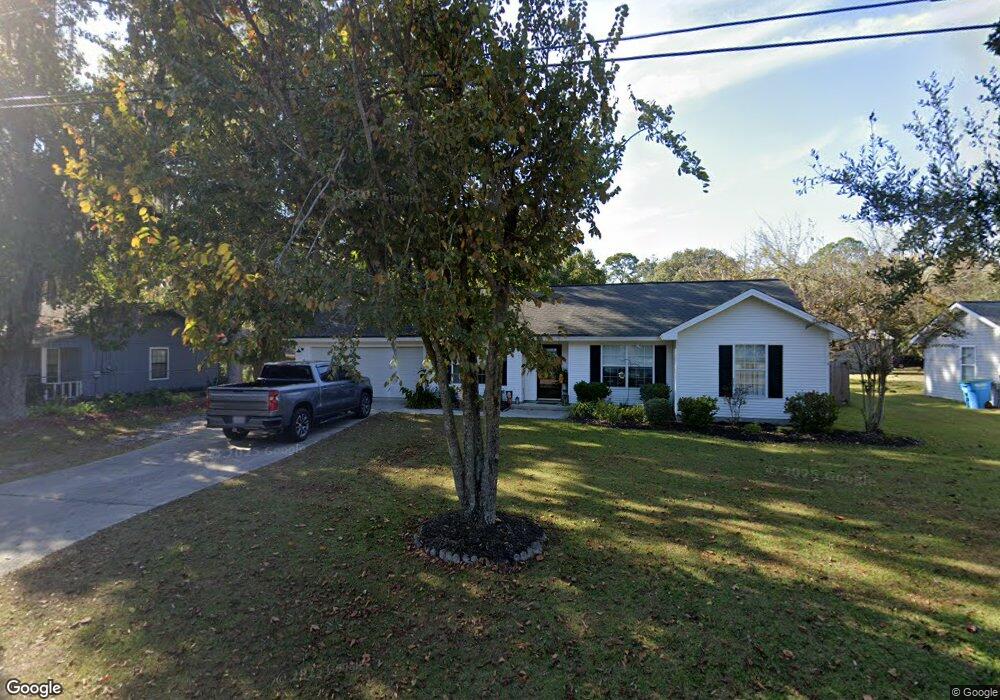
403 Cherry St Bloomingdale, GA 31302
Estimated Value: $287,000 - $307,000
3
Beds
2
Baths
1,283
Sq Ft
$229/Sq Ft
Est. Value
About This Home
This home is located at 403 Cherry St, Bloomingdale, GA 31302 and is currently estimated at $293,538, approximately $228 per square foot. 403 Cherry St is a home located in Chatham County with nearby schools including West Chatham Middle School and Groves High School.
Ownership History
Date
Name
Owned For
Owner Type
Purchase Details
Closed on
Dec 15, 2016
Sold by
Stephanie A
Bought by
Lagana Mark Richard
Current Estimated Value
Home Financials for this Owner
Home Financials are based on the most recent Mortgage that was taken out on this home.
Original Mortgage
$163,214
Outstanding Balance
$132,801
Interest Rate
3.94%
Mortgage Type
VA
Estimated Equity
$160,737
Purchase Details
Closed on
Dec 14, 2007
Sold by
Not Provided
Bought by
Carter Stephanie A
Home Financials for this Owner
Home Financials are based on the most recent Mortgage that was taken out on this home.
Original Mortgage
$131,000
Interest Rate
6.21%
Mortgage Type
New Conventional
Create a Home Valuation Report for This Property
The Home Valuation Report is an in-depth analysis detailing your home's value as well as a comparison with similar homes in the area
Home Values in the Area
Average Home Value in this Area
Purchase History
| Date | Buyer | Sale Price | Title Company |
|---|---|---|---|
| Lagana Mark Richard | $158,000 | -- | |
| Carter Stephanie A | $141,000 | -- | |
| Carter Stephanie A | $141,000 | -- |
Source: Public Records
Mortgage History
| Date | Status | Borrower | Loan Amount |
|---|---|---|---|
| Open | Lagana Mark Richard | $163,214 | |
| Previous Owner | Carter Stephanie A | $131,000 | |
| Previous Owner | Carter Stephanie A | $10,000 |
Source: Public Records
Tax History Compared to Growth
Tax History
| Year | Tax Paid | Tax Assessment Tax Assessment Total Assessment is a certain percentage of the fair market value that is determined by local assessors to be the total taxable value of land and additions on the property. | Land | Improvement |
|---|---|---|---|---|
| 2025 | $3,080 | $107,720 | $30,000 | $77,720 |
| 2024 | $3,080 | $95,600 | $20,000 | $75,600 |
| 2023 | $2,273 | $80,760 | $15,600 | $65,160 |
| 2022 | $1,680 | $53,080 | $7,800 | $45,280 |
| 2021 | $1,658 | $56,600 | $7,800 | $48,800 |
| 2020 | $1,722 | $56,600 | $7,800 | $48,800 |
| 2019 | $1,722 | $56,600 | $7,800 | $48,800 |
| 2018 | $1,682 | $55,280 | $7,800 | $47,480 |
| 2017 | $1,547 | $54,920 | $7,040 | $47,880 |
| 2016 | $1,284 | $54,240 | $7,040 | $47,200 |
| 2015 | $1,302 | $55,120 | $7,320 | $47,800 |
| 2014 | $1,906 | $55,880 | $0 | $0 |
Source: Public Records
Map
Nearby Homes