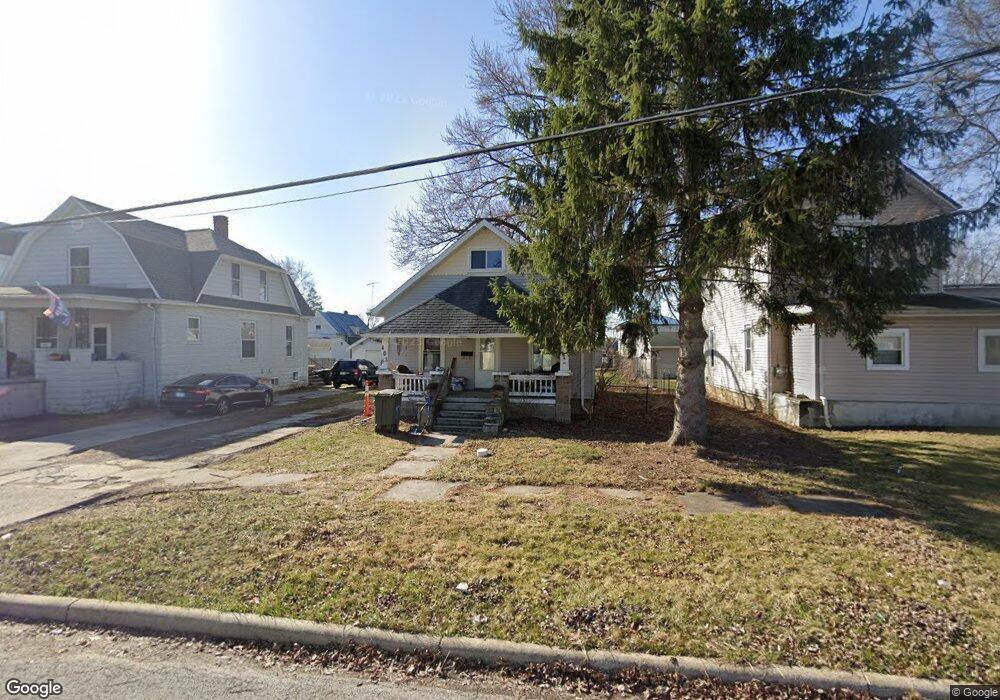
403 Cherry St Findlay, OH 45840
Estimated Value: $127,009 - $174,000
3
Beds
3
Baths
1,080
Sq Ft
$139/Sq Ft
Est. Value
About This Home
This home is located at 403 Cherry St, Findlay, OH 45840 and is currently estimated at $150,002, approximately $138 per square foot. 403 Cherry St is a home located in Hancock County with nearby schools including Whittier Primary School, Bigelow Hill Elementary School, and Glenwood Middle School.
Ownership History
Date
Name
Owned For
Owner Type
Purchase Details
Closed on
Sep 2, 1997
Sold by
Zimmerly Pamela
Bought by
Trinko Janice
Current Estimated Value
Home Financials for this Owner
Home Financials are based on the most recent Mortgage that was taken out on this home.
Original Mortgage
$62,883
Outstanding Balance
$9,831
Interest Rate
7.57%
Mortgage Type
FHA
Estimated Equity
$140,171
Purchase Details
Closed on
Aug 18, 1993
Bought by
Zimmerly Pamela E
Purchase Details
Closed on
May 19, 1988
Bought by
Zimmerly Douglas A
Create a Home Valuation Report for This Property
The Home Valuation Report is an in-depth analysis detailing your home's value as well as a comparison with similar homes in the area
Home Values in the Area
Average Home Value in this Area
Purchase History
| Date | Buyer | Sale Price | Title Company |
|---|---|---|---|
| Trinko Janice | $63,500 | -- | |
| Zimmerly Pamela E | -- | -- | |
| Zimmerly Douglas A | $34,000 | -- |
Source: Public Records
Mortgage History
| Date | Status | Borrower | Loan Amount |
|---|---|---|---|
| Open | Trinko Janice | $62,883 |
Source: Public Records
Tax History Compared to Growth
Tax History
| Year | Tax Paid | Tax Assessment Tax Assessment Total Assessment is a certain percentage of the fair market value that is determined by local assessors to be the total taxable value of land and additions on the property. | Land | Improvement |
|---|---|---|---|---|
| 2024 | $957 | $26,930 | $5,300 | $21,630 |
| 2023 | $958 | $26,930 | $5,300 | $21,630 |
| 2022 | $955 | $26,930 | $5,300 | $21,630 |
| 2021 | $837 | $20,560 | $5,590 | $14,970 |
| 2020 | $837 | $20,560 | $5,590 | $14,970 |
| 2019 | $820 | $20,560 | $5,590 | $14,970 |
| 2018 | $824 | $18,960 | $3,990 | $14,970 |
| 2017 | $412 | $18,960 | $3,990 | $14,970 |
| 2016 | $1,330 | $18,960 | $3,990 | $14,970 |
| 2015 | $870 | $19,900 | $4,800 | $15,100 |
| 2014 | $870 | $19,900 | $4,800 | $15,100 |
| 2012 | $796 | $18,050 | $4,800 | $13,250 |
Source: Public Records
Map
Nearby Homes
- 523 Center St
- 213 Cherry St
- 545 Clinton Ct
- 0 Canadian Way Unit 20253551
- 0 Canadian Way Unit 6135400
- 247 Crystal Ave
- 207 Ash Ave
- 512 N Cory St
- 706 N Cory St
- 224 Defiance Ave
- 210 Eastowne Park Row
- 407 Washington St
- 115 George St
- 230 Midland Ave
- 206 Midland Ave
- 420 Allen Ave
- 514 Liberty St
- 716 Winfield Ave
- 817 Park St
- 1001 Decker Ave