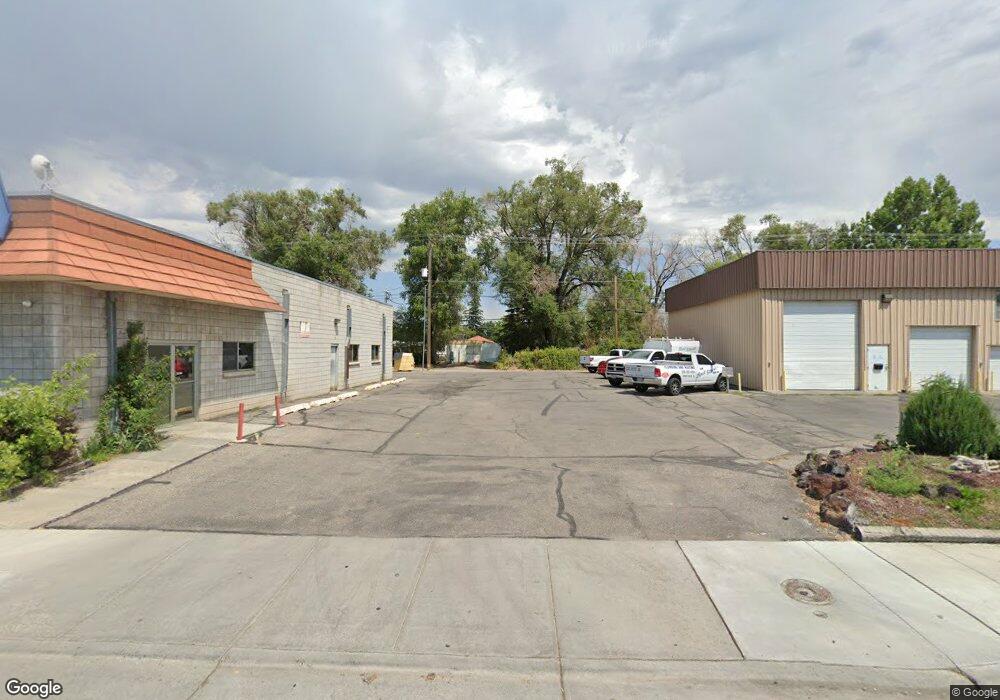
403 E 1st St Idaho Falls, ID 83401
Estimated Value: $533,000 - $773,000
4
Beds
9
Baths
8,200
Sq Ft
$82/Sq Ft
Est. Value
About This Home
This home is located at 403 E 1st St, Idaho Falls, ID 83401 and is currently estimated at $676,333, approximately $82 per square foot. 403 E 1st St is a home located in Bonneville County with nearby schools including Dora Erickson Elementary School, Taylorview Middle School, and Idaho Falls Senior High School.
Ownership History
Date
Name
Owned For
Owner Type
Purchase Details
Closed on
Jun 17, 2020
Sold by
Mega Marketing Llc
Bought by
Smiley Face Llc
Current Estimated Value
Purchase Details
Closed on
Dec 5, 2019
Sold by
Home Relief Investments Llc
Bought by
Mega Marketing Llc
Purchase Details
Closed on
Jan 20, 2016
Sold by
Christensen Boyd and Christensen Roxanne
Bought by
Home Relief Investments Llc
Purchase Details
Closed on
Feb 16, 2007
Sold by
Sayer Warren R and Sayer Mona R
Bought by
Christensen Boyd and Christensen Roxanne
Create a Home Valuation Report for This Property
The Home Valuation Report is an in-depth analysis detailing your home's value as well as a comparison with similar homes in the area
Home Values in the Area
Average Home Value in this Area
Purchase History
| Date | Buyer | Sale Price | Title Company |
|---|---|---|---|
| Smiley Face Llc | -- | Accommodation | |
| Mega Marketing Llc | -- | Pioneer Title Pocatello | |
| Home Relief Investments Llc | -- | Alliance Title & Escrow Corp | |
| Christensen Boyd | -- | Mountain West Title & Escrow |
Source: Public Records
Tax History Compared to Growth
Tax History
| Year | Tax Paid | Tax Assessment Tax Assessment Total Assessment is a certain percentage of the fair market value that is determined by local assessors to be the total taxable value of land and additions on the property. | Land | Improvement |
|---|---|---|---|---|
| 2025 | $5,856 | $572,865 | $12,399 | $560,466 |
| 2024 | $5,856 | $578,327 | $52,200 | $526,127 |
| 2023 | $5,900 | $562,257 | $55,990 | $506,267 |
| 2022 | $6,119 | $475,457 | $55,990 | $419,467 |
| 2021 | $5,525 | $381,427 | $55,990 | $325,437 |
| 2019 | $6,608 | $359,637 | $55,990 | $303,647 |
| 2018 | $6,794 | $356,914 | $34,458 | $322,456 |
| 2017 | $6,556 | $349,694 | $34,458 | $315,236 |
| 2016 | $6,419 | $340,664 | $34,458 | $306,206 |
| 2015 | $2,969 | $306,056 | $40,851 | $265,205 |
| 2014 | -- | $306,056 | $40,851 | $265,205 |
Source: Public Records
Map
Nearby Homes