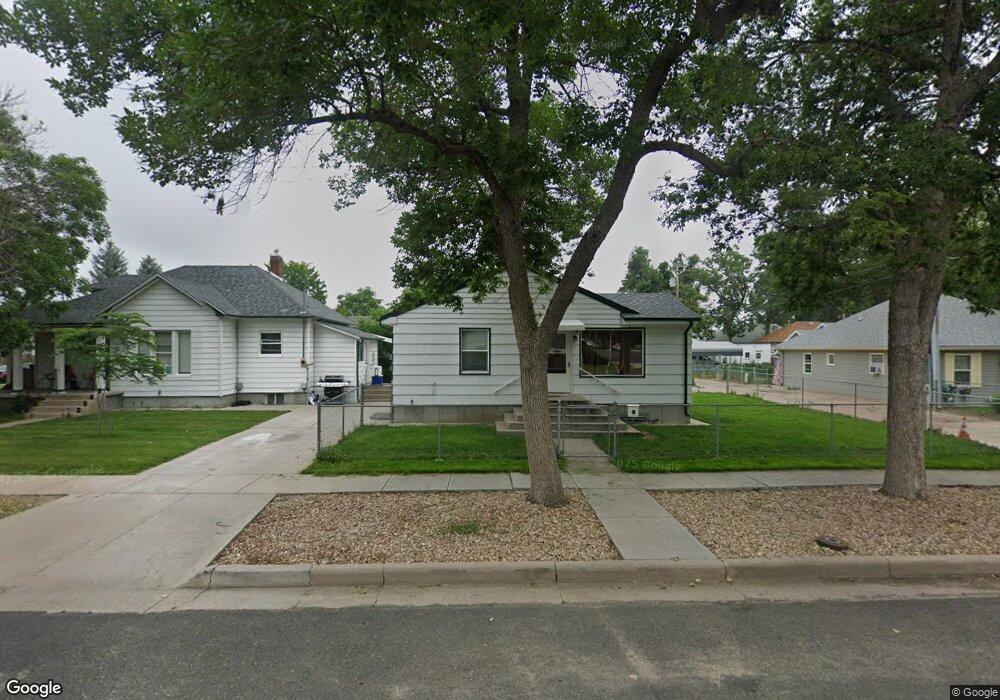
403 E 6th Ave Fort Morgan, CO 80701
Estimated Value: $317,000 - $432,000
3
Beds
1
Bath
1,684
Sq Ft
$232/Sq Ft
Est. Value
About This Home
This home is located at 403 E 6th Ave, Fort Morgan, CO 80701 and is currently estimated at $391,209, approximately $232 per square foot. 403 E 6th Ave is a home with nearby schools including Fort Morgan High School.
Ownership History
Date
Name
Owned For
Owner Type
Purchase Details
Closed on
Feb 25, 2025
Sold by
Lightspace Investments Llc
Bought by
3 T Cattle Company Inc
Current Estimated Value
Purchase Details
Closed on
Dec 24, 2022
Sold by
Howard E Wickham Living Trust
Bought by
Lightspace Investments Llc
Home Financials for this Owner
Home Financials are based on the most recent Mortgage that was taken out on this home.
Original Mortgage
$345,364
Interest Rate
7.08%
Mortgage Type
Seller Take Back
Purchase Details
Closed on
Jul 15, 2019
Sold by
Wickham Howard E and Wickham Judy L
Bought by
The Howard E Wickman Living Trust
Create a Home Valuation Report for This Property
The Home Valuation Report is an in-depth analysis detailing your home's value as well as a comparison with similar homes in the area
Purchase History
| Date | Buyer | Sale Price | Title Company |
|---|---|---|---|
| 3 T Cattle Company Inc | $410,000 | None Listed On Document | |
| Lightspace Investments Llc | $356,045 | -- | |
| The Howard E Wickman Living Trust | -- | None Available |
Source: Public Records
Mortgage History
| Date | Status | Borrower | Loan Amount |
|---|---|---|---|
| Previous Owner | Lightspace Investments Llc | $345,364 |
Source: Public Records
Tax History
| Year | Tax Paid | Tax Assessment Tax Assessment Total Assessment is a certain percentage of the fair market value that is determined by local assessors to be the total taxable value of land and additions on the property. | Land | Improvement |
|---|---|---|---|---|
| 2024 | $2,252 | $28,120 | $2,770 | $25,350 |
| 2023 | $2,283 | $31,800 | $3,130 | $28,670 |
| 2022 | $1,944 | $23,720 | $3,060 | $20,660 |
| 2021 | $2,002 | $24,400 | $3,150 | $21,250 |
| 2020 | $1,752 | $20,780 | $3,000 | $17,780 |
| 2019 | $1,755 | $20,780 | $3,000 | $17,780 |
| 2018 | $1,328 | $15,500 | $2,420 | $13,080 |
| 2017 | $1,330 | $15,500 | $2,420 | $13,080 |
| 2016 | $1,246 | $14,390 | $2,090 | $12,300 |
| 2015 | $1,228 | $14,390 | $2,090 | $12,300 |
| 2014 | $1,208 | $13,800 | $1,670 | $12,130 |
| 2013 | $1,172 | $13,800 | $1,670 | $12,130 |
Source: Public Records
Map
Nearby Homes
Your Personal Tour Guide
Ask me questions while you tour the home.