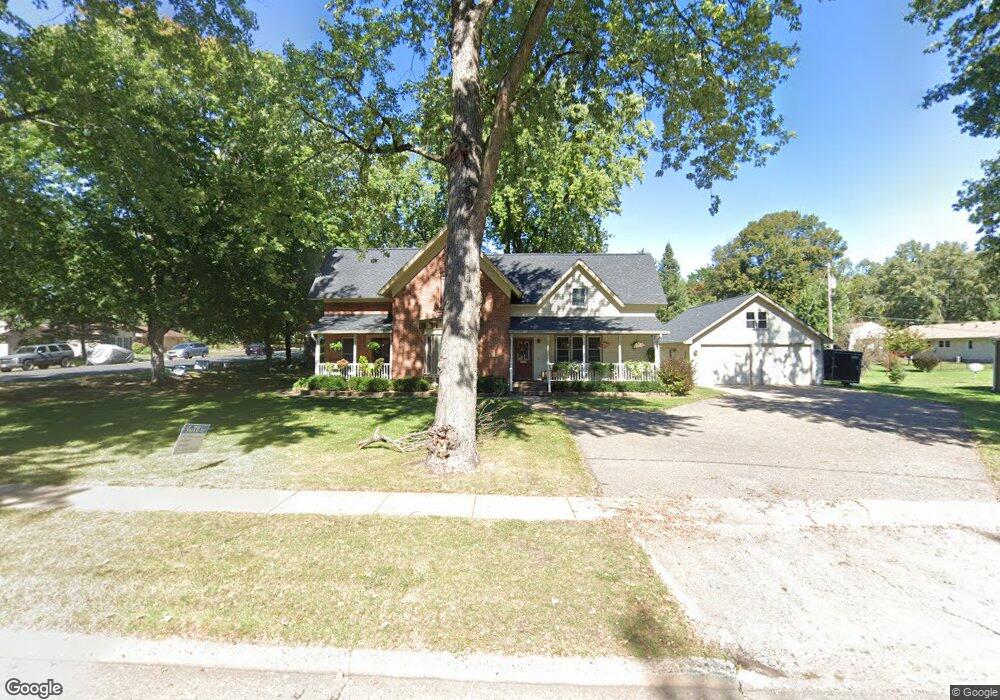
403 E Division St River Falls, WI 54022
Estimated Value: $395,000 - $463,000
3
Beds
3
Baths
--
Sq Ft
21,344
Sq Ft Lot
About This Home
This home is located at 403 E Division St, River Falls, WI 54022 and is currently estimated at $419,322. 403 E Division St is a home located in St. Croix County with nearby schools including Greenwood Elementary School, Meyer Middle School, and River Falls High School.
Ownership History
Date
Name
Owned For
Owner Type
Purchase Details
Closed on
Sep 30, 2016
Sold by
Black David W and Black Mary C
Bought by
Mottaz Carole A
Current Estimated Value
Purchase Details
Closed on
Feb 11, 2005
Sold by
Gnatzig William H and Gnatzig Susan M
Bought by
Black David W and Black Mary C
Home Financials for this Owner
Home Financials are based on the most recent Mortgage that was taken out on this home.
Original Mortgage
$236,000
Interest Rate
5.83%
Mortgage Type
Construction
Create a Home Valuation Report for This Property
The Home Valuation Report is an in-depth analysis detailing your home's value as well as a comparison with similar homes in the area
Home Values in the Area
Average Home Value in this Area
Purchase History
| Date | Buyer | Sale Price | Title Company |
|---|---|---|---|
| Mottaz Carole A | $274,000 | Land Title Inc | |
| Black David W | $172,800 | None Available |
Source: Public Records
Mortgage History
| Date | Status | Borrower | Loan Amount |
|---|---|---|---|
| Previous Owner | Black David W | $236,000 |
Source: Public Records
Tax History
| Year | Tax Paid | Tax Assessment Tax Assessment Total Assessment is a certain percentage of the fair market value that is determined by local assessors to be the total taxable value of land and additions on the property. | Land | Improvement |
|---|---|---|---|---|
| 2025 | $5,565 | $410,400 | $91,100 | $319,300 |
| 2024 | $53 | $297,400 | $67,400 | $230,000 |
| 2023 | $4,707 | $297,400 | $67,400 | $230,000 |
| 2022 | $4,627 | $297,400 | $67,400 | $230,000 |
| 2021 | $5,048 | $297,400 | $67,400 | $230,000 |
| 2020 | $4,772 | $239,400 | $49,500 | $189,900 |
| 2019 | $4,717 | $233,800 | $49,500 | $184,300 |
| 2018 | $4,470 | $233,800 | $49,500 | $184,300 |
| 2017 | $4,396 | $230,700 | $49,500 | $181,200 |
| 2016 | $4,396 | $230,700 | $49,500 | $181,200 |
| 2015 | $4,342 | $230,700 | $49,500 | $181,200 |
| 2014 | $4,257 | $248,200 | $57,700 | $190,500 |
| 2013 | $4,400 | $248,200 | $57,700 | $190,500 |
Source: Public Records
Map
Nearby Homes
Your Personal Tour Guide
Ask me questions while you tour the home.