403 E Spring St Fremont, IN 46737
Estimated Value: $149,000 - $208,000
3
Beds
1
Bath
800
Sq Ft
$212/Sq Ft
Est. Value
About This Home
This home is located at 403 E Spring St, Fremont, IN 46737 and is currently estimated at $169,936, approximately $212 per square foot. 403 E Spring St is a home located in Steuben County with nearby schools including Fremont Elementary School, Fremont Middle School, and Fremont High School.
Ownership History
Date
Name
Owned For
Owner Type
Purchase Details
Closed on
Aug 1, 2018
Sold by
Tolar Sallie R
Bought by
Kohl Brodie J
Current Estimated Value
Home Financials for this Owner
Home Financials are based on the most recent Mortgage that was taken out on this home.
Original Mortgage
$74,747
Outstanding Balance
$64,233
Interest Rate
4.5%
Mortgage Type
New Conventional
Estimated Equity
$105,703
Purchase Details
Closed on
Nov 15, 2016
Sold by
Moffett Donna J
Bought by
Tolar Sallie R
Home Financials for this Owner
Home Financials are based on the most recent Mortgage that was taken out on this home.
Original Mortgage
$48,840
Interest Rate
3.47%
Mortgage Type
FHA
Purchase Details
Closed on
Dec 27, 2011
Sold by
Moffett Jim and Kelley Judy
Bought by
Moffett Donna J
Purchase Details
Closed on
Jul 12, 2011
Sold by
Moffett Donna J
Bought by
Moffett Jim and Kelley Judy
Purchase Details
Closed on
Apr 7, 2010
Sold by
Moffett Paul L
Bought by
Moffett Donna J
Create a Home Valuation Report for This Property
The Home Valuation Report is an in-depth analysis detailing your home's value as well as a comparison with similar homes in the area
Purchase History
| Date | Buyer | Sale Price | Title Company |
|---|---|---|---|
| Kohl Brodie J | $74,000 | Metropolitan Title Of Indian | |
| Tolar Sallie R | -- | None Available | |
| Moffett Donna J | -- | None Available | |
| Moffett Jim | -- | None Available | |
| Moffett Donna J | -- | None Available |
Source: Public Records
Mortgage History
| Date | Status | Borrower | Loan Amount |
|---|---|---|---|
| Open | Kohl Brodie J | $74,747 | |
| Previous Owner | Tolar Sallie R | $48,840 |
Source: Public Records
Tax History
| Year | Tax Paid | Tax Assessment Tax Assessment Total Assessment is a certain percentage of the fair market value that is determined by local assessors to be the total taxable value of land and additions on the property. | Land | Improvement |
|---|---|---|---|---|
| 2025 | $546 | $121,400 | $17,200 | $104,200 |
| 2024 | $546 | $112,000 | $15,600 | $96,400 |
| 2023 | $535 | $110,800 | $14,900 | $95,900 |
| 2022 | $286 | $79,100 | $13,200 | $65,900 |
| 2021 | $1,174 | $73,600 | $13,200 | $60,400 |
| 2020 | $1,200 | $73,600 | $13,200 | $60,400 |
| 2019 | $1,074 | $66,000 | $13,200 | $52,800 |
| 2018 | $1,097 | $64,300 | $13,200 | $51,100 |
| 2017 | $1,020 | $59,700 | $13,200 | $46,500 |
| 2016 | $18 | $57,100 | $13,200 | $43,900 |
| 2014 | $12 | $55,300 | $13,200 | $42,100 |
| 2013 | $12 | $55,700 | $13,200 | $42,500 |
Source: Public Records
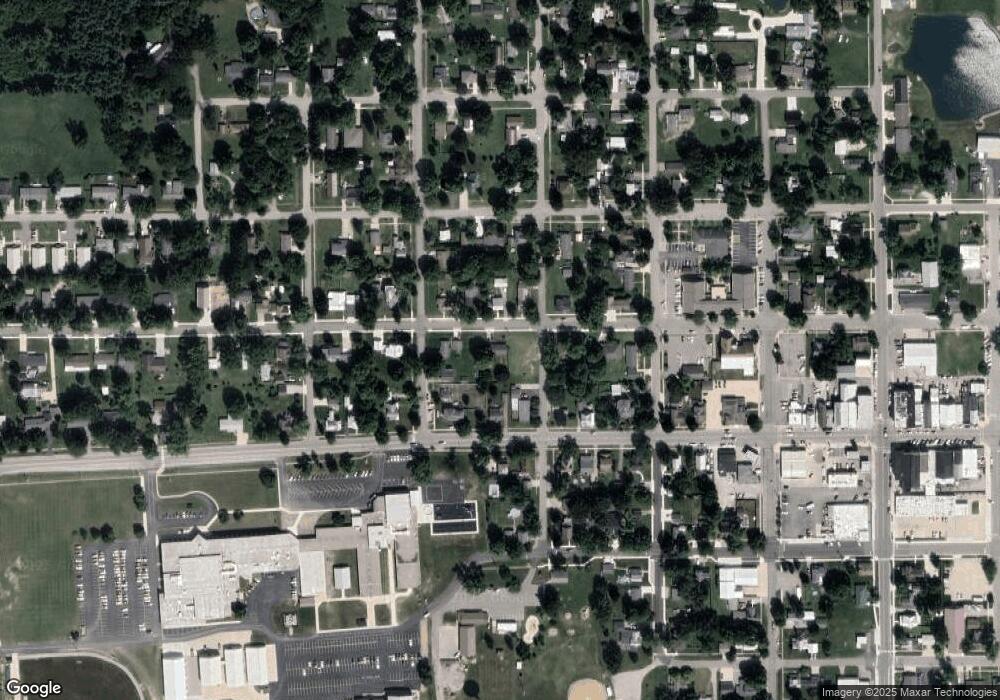
Map
Nearby Homes
- 501 E Toledo St
- 304 Hardy St
- 300 N Coldwater St
- 609 W Cora Ln
- 6405 N 300 E
- 00 N 300 Rd E
- 50 Janedale Dr
- TBD Gerald Lett Unit 1
- Lot 9 Arapaho Pass
- 7050 N van Guilder Rd
- 189 E State Road 120
- W State Rd
- 3910 N 40 E
- 6430 E 784 N
- 00 E State Road 120
- 30 Indiana 120
- 4061 N 006 E
- 538 Fallen Oaks Dr
- 2620 N 475 E
- 2915 N State Road 827
- 401 E Spring St
- 405 E Spring St
- 402 E North St
- 407 E Spring St
- 206 N Tillotson St
- 404 E North St
- 307 E Spring St
- 207 N Sierer St
- 404 E Spring St
- 106 N Tillotson St
- 306 E North St
- 305 E Spring St
- 501 E Spring St
- 107 N Tillotson St
- 206 N Sierer St
- 101 N Ray Rd
- 503 E Spring St
- 401 E North St
- 101 N Ray St
- 405 E Toledo St
Your Personal Tour Guide
Ask me questions while you tour the home.