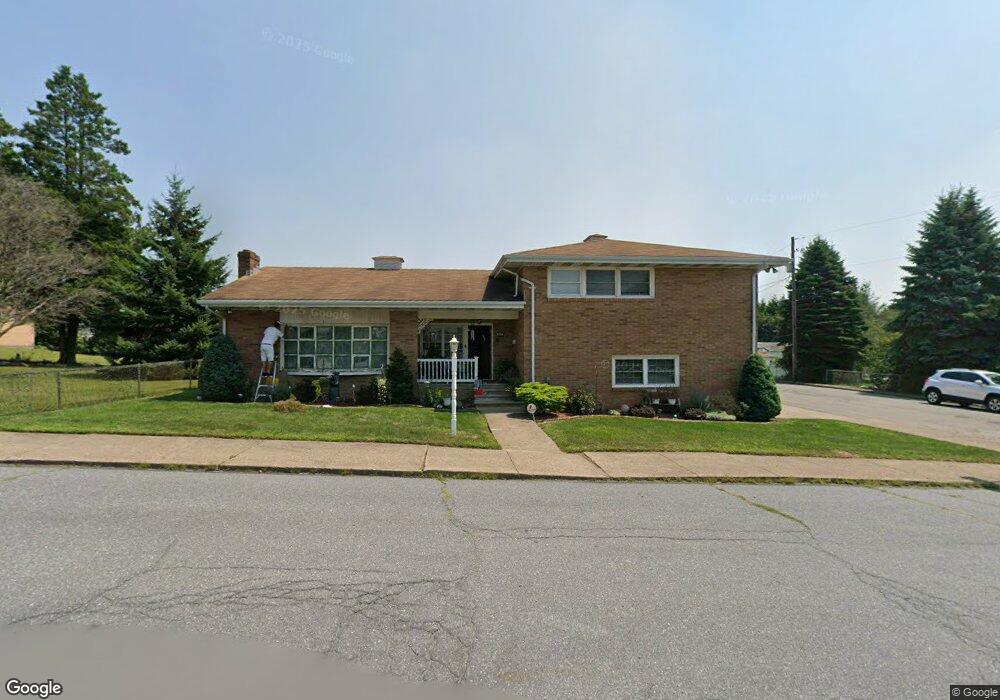
403 Fern St Freeland, PA 18224
Estimated Value: $218,191 - $265,000
--
Bed
--
Bath
2,207
Sq Ft
$107/Sq Ft
Est. Value
About This Home
This home is located at 403 Fern St, Freeland, PA 18224 and is currently estimated at $236,798, approximately $107 per square foot. 403 Fern St is a home located in Luzerne County with nearby schools including Hazleton Area High School and Mmi Preparatory School.
Ownership History
Date
Name
Owned For
Owner Type
Purchase Details
Closed on
Jul 20, 2018
Sold by
Herbener Darrin and Herbenerb Tracy
Bought by
Almonte Juan
Current Estimated Value
Home Financials for this Owner
Home Financials are based on the most recent Mortgage that was taken out on this home.
Original Mortgage
$158,650
Outstanding Balance
$137,494
Interest Rate
4.5%
Mortgage Type
New Conventional
Estimated Equity
$99,304
Purchase Details
Closed on
Dec 30, 2003
Bought by
Herbener Darrin
Create a Home Valuation Report for This Property
The Home Valuation Report is an in-depth analysis detailing your home's value as well as a comparison with similar homes in the area
Home Values in the Area
Average Home Value in this Area
Purchase History
| Date | Buyer | Sale Price | Title Company |
|---|---|---|---|
| Almonte Juan | $167,000 | Covenant Abstract | |
| Herbener Darrin | $134,700 | -- |
Source: Public Records
Mortgage History
| Date | Status | Borrower | Loan Amount |
|---|---|---|---|
| Open | Almonte Juan | $158,650 |
Source: Public Records
Tax History Compared to Growth
Tax History
| Year | Tax Paid | Tax Assessment Tax Assessment Total Assessment is a certain percentage of the fair market value that is determined by local assessors to be the total taxable value of land and additions on the property. | Land | Improvement |
|---|---|---|---|---|
| 2025 | $4,532 | $182,300 | $23,700 | $158,600 |
| 2024 | $4,381 | $182,300 | $23,700 | $158,600 |
| 2023 | $4,311 | $182,300 | $23,700 | $158,600 |
| 2022 | $4,265 | $182,300 | $23,700 | $158,600 |
| 2021 | $4,159 | $182,300 | $23,700 | $158,600 |
| 2020 | $3,917 | $182,300 | $23,700 | $158,600 |
| 2019 | $3,779 | $182,300 | $23,700 | $158,600 |
| 2018 | $3,660 | $182,300 | $23,700 | $158,600 |
| 2017 | $3,594 | $182,300 | $23,700 | $158,600 |
| 2016 | -- | $182,300 | $23,700 | $158,600 |
| 2015 | $2,508 | $182,300 | $23,700 | $158,600 |
| 2014 | $2,508 | $182,300 | $23,700 | $158,600 |
Source: Public Records
Map
Nearby Homes