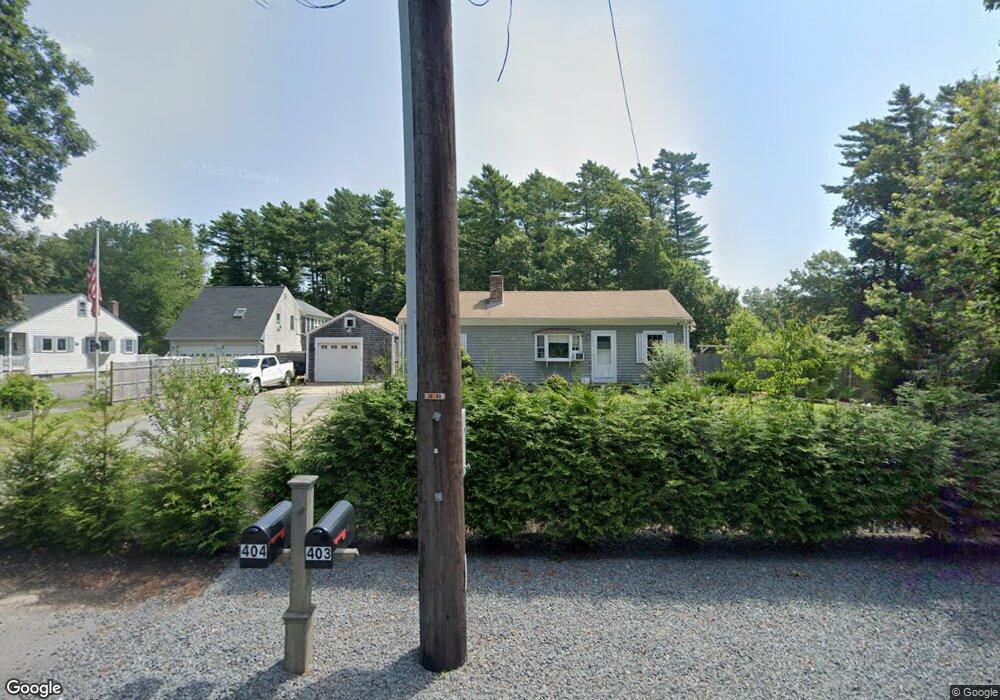
403 Front St Marion, MA 02738
Estimated Value: $473,000 - $571,000
3
Beds
1
Bath
1,056
Sq Ft
$490/Sq Ft
Est. Value
About This Home
This home is located at 403 Front St, Marion, MA 02738 and is currently estimated at $517,540, approximately $490 per square foot. 403 Front St is a home located in Plymouth County with nearby schools including Old Rochester Regional High School and Tabor Academy.
Ownership History
Date
Name
Owned For
Owner Type
Purchase Details
Closed on
Aug 4, 2017
Sold by
Braga Donald K and English-Braga Megan E
Bought by
Martin Amanda L and Estrella Jeremy A
Current Estimated Value
Home Financials for this Owner
Home Financials are based on the most recent Mortgage that was taken out on this home.
Original Mortgage
$270,300
Outstanding Balance
$225,178
Interest Rate
3.9%
Mortgage Type
New Conventional
Estimated Equity
$292,362
Purchase Details
Closed on
May 29, 2012
Sold by
Braga Donald K
Bought by
Braga Donald K and English-Braga Megan E
Purchase Details
Closed on
Mar 29, 2002
Sold by
Laycock Theodore
Bought by
Braga Donald K
Home Financials for this Owner
Home Financials are based on the most recent Mortgage that was taken out on this home.
Original Mortgage
$130,000
Interest Rate
6.88%
Mortgage Type
Purchase Money Mortgage
Create a Home Valuation Report for This Property
The Home Valuation Report is an in-depth analysis detailing your home's value as well as a comparison with similar homes in the area
Purchase History
| Date | Buyer | Sale Price | Title Company |
|---|---|---|---|
| Martin Amanda L | $318,000 | -- | |
| Braga Donald K | -- | -- | |
| Braga Donald K | $145,000 | -- |
Source: Public Records
Mortgage History
| Date | Status | Borrower | Loan Amount |
|---|---|---|---|
| Open | Martin Amanda L | $270,300 | |
| Previous Owner | Braga Donald K | $25,000 | |
| Previous Owner | Braga Donald K | $129,000 | |
| Previous Owner | Braga Donald K | $130,000 |
Source: Public Records
Tax History
| Year | Tax Paid | Tax Assessment Tax Assessment Total Assessment is a certain percentage of the fair market value that is determined by local assessors to be the total taxable value of land and additions on the property. | Land | Improvement |
|---|---|---|---|---|
| 2025 | $3,753 | $402,700 | $182,000 | $220,700 |
| 2024 | $3,549 | $383,300 | $159,300 | $224,000 |
| 2023 | $3,985 | $422,100 | $227,500 | $194,600 |
| 2022 | $3,421 | $315,300 | $140,000 | $175,300 |
| 2021 | $3,219 | $284,400 | $122,500 | $161,900 |
| 2020 | $3,249 | $277,700 | $122,500 | $155,200 |
| 2019 | $2,971 | $269,400 | $122,500 | $146,900 |
| 2018 | $2,832 | $247,300 | $117,800 | $129,500 |
| 2017 | $2,729 | $239,200 | $117,800 | $121,400 |
| 2016 | $2,742 | $242,400 | $117,800 | $124,600 |
| 2015 | $2,589 | $233,000 | $124,500 | $108,500 |
Source: Public Records
Map
Nearby Homes
Your Personal Tour Guide
Ask me questions while you tour the home.