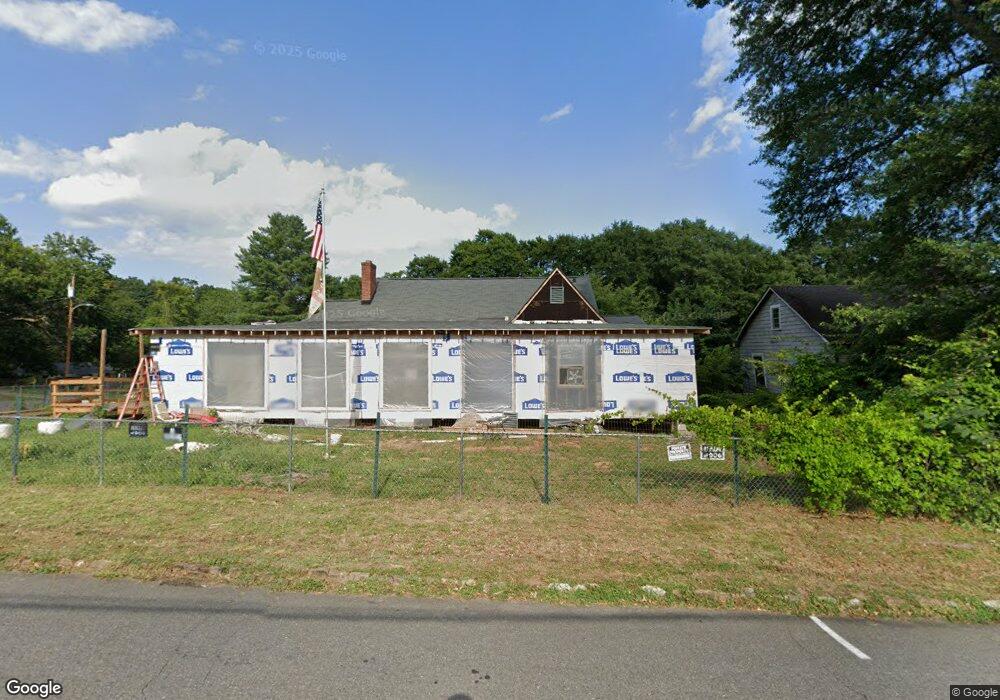
403 Gold St Shelby, NC 28150
Estimated Value: $168,837 - $327,000
--
Bed
--
Bath
2,663
Sq Ft
$92/Sq Ft
Est. Value
About This Home
This home is located at 403 Gold St, Shelby, NC 28150 and is currently estimated at $244,959, approximately $91 per square foot. 403 Gold St is a home located in Cleveland County with nearby schools including Graham Elementary School, Shelby Middle School, and Shelby High School.
Ownership History
Date
Name
Owned For
Owner Type
Purchase Details
Closed on
Nov 24, 2021
Sold by
Livingston James Ronald and Livingston James R
Bought by
Green Stephanie Ann and Green Samuel Lee
Current Estimated Value
Purchase Details
Closed on
Jul 22, 2010
Sold by
Livingston James R
Bought by
Livingston James R and Livingston Marsha Kay
Home Financials for this Owner
Home Financials are based on the most recent Mortgage that was taken out on this home.
Original Mortgage
$84,279
Interest Rate
3.5%
Mortgage Type
VA
Purchase Details
Closed on
Aug 12, 2005
Sold by
Deaton Powell Nellie Earls and Deaton Nellif Farls
Bought by
Livingston James R and Livingston Marsha M
Home Financials for this Owner
Home Financials are based on the most recent Mortgage that was taken out on this home.
Original Mortgage
$54,880
Interest Rate
5.48%
Mortgage Type
New Conventional
Create a Home Valuation Report for This Property
The Home Valuation Report is an in-depth analysis detailing your home's value as well as a comparison with similar homes in the area
Home Values in the Area
Average Home Value in this Area
Purchase History
| Date | Buyer | Sale Price | Title Company |
|---|---|---|---|
| Green Stephanie Ann | -- | None Available | |
| Livingston James Ronald | -- | None Listed On Document | |
| Livingston James R | -- | National Title Network | |
| Livingston James R | $69,000 | None Available |
Source: Public Records
Mortgage History
| Date | Status | Borrower | Loan Amount |
|---|---|---|---|
| Previous Owner | Livingston James R | $84,279 | |
| Previous Owner | Livingston James R | $54,880 |
Source: Public Records
Tax History Compared to Growth
Tax History
| Year | Tax Paid | Tax Assessment Tax Assessment Total Assessment is a certain percentage of the fair market value that is determined by local assessors to be the total taxable value of land and additions on the property. | Land | Improvement |
|---|---|---|---|---|
| 2025 | $1,341 | $179,743 | $13,910 | $165,833 |
| 2024 | $502 | $84,605 | $11,426 | $73,179 |
| 2023 | $502 | $84,605 | $11,426 | $73,179 |
| 2022 | $500 | $84,605 | $11,426 | $73,179 |
| 2021 | $502 | $84,605 | $11,426 | $73,179 |
| 2020 | $586 | $90,388 | $11,426 | $78,962 |
| 2019 | $586 | $90,388 | $11,426 | $78,962 |
| 2018 | $585 | $90,388 | $11,426 | $78,962 |
| 2017 | $570 | $90,388 | $11,426 | $78,962 |
| 2016 | $571 | $90,388 | $11,426 | $78,962 |
| 2015 | $1,233 | $105,175 | $11,426 | $93,749 |
| 2014 | $1,233 | $105,175 | $11,426 | $93,749 |
Source: Public Records
Map
Nearby Homes