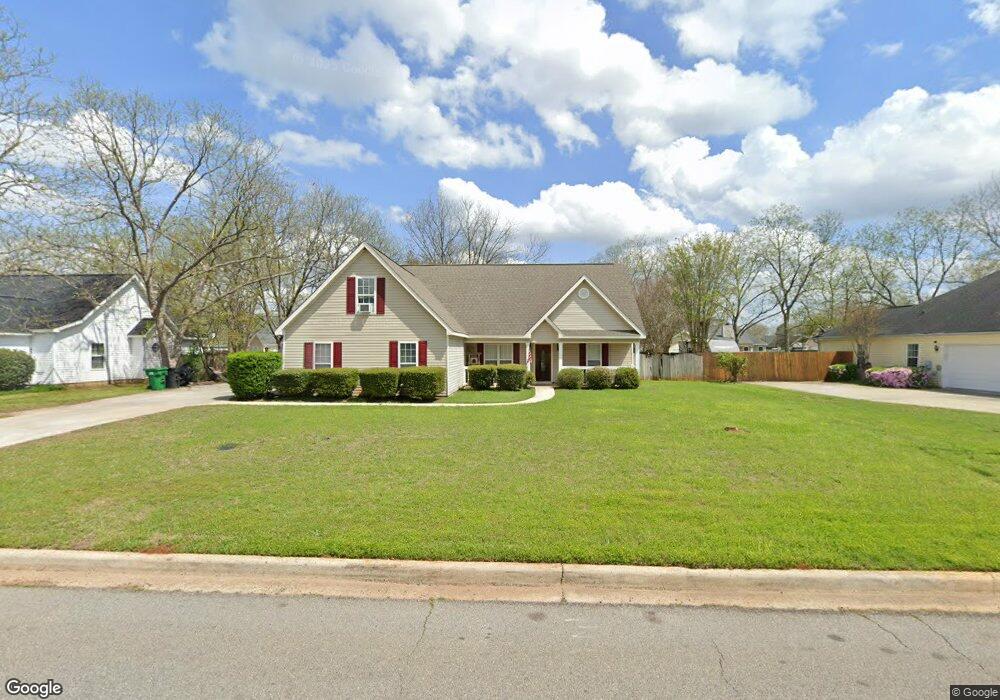
403 Grove Ln Kathleen, GA 31047
Estimated Value: $306,000 - $327,000
4
Beds
2
Baths
2,044
Sq Ft
$153/Sq Ft
Est. Value
About This Home
This home is located at 403 Grove Ln, Kathleen, GA 31047 and is currently estimated at $313,241, approximately $153 per square foot. 403 Grove Ln is a home located in Houston County with nearby schools including Matthew Arthur Elementary School, Bonaire Middle School, and Veterans High School.
Ownership History
Date
Name
Owned For
Owner Type
Purchase Details
Closed on
Jun 29, 2007
Sold by
Witt Ransom S
Bought by
Witt Ransom S and Witt Janice A
Current Estimated Value
Home Financials for this Owner
Home Financials are based on the most recent Mortgage that was taken out on this home.
Original Mortgage
$152,000
Outstanding Balance
$93,305
Interest Rate
6.16%
Mortgage Type
New Conventional
Estimated Equity
$219,936
Purchase Details
Closed on
Sep 30, 2003
Sold by
Household Bank Fsb
Bought by
Odom Larry J and Odom Laura L
Purchase Details
Closed on
Jun 3, 2003
Sold by
Craft James Randall
Bought by
Household Bank Fsb
Purchase Details
Closed on
Sep 1, 1999
Sold by
Coming Attractions Custom Built Homes
Bought by
Craft James Randall
Purchase Details
Closed on
Mar 31, 1999
Sold by
Walker'S Grove Inc
Bought by
Coming Attractions Custom Built Homes
Create a Home Valuation Report for This Property
The Home Valuation Report is an in-depth analysis detailing your home's value as well as a comparison with similar homes in the area
Home Values in the Area
Average Home Value in this Area
Purchase History
| Date | Buyer | Sale Price | Title Company |
|---|---|---|---|
| Witt Ransom S | -- | None Available | |
| Witt Ransom S | $152,000 | None Available | |
| Weichert Relocation Resources Inc | $173,500 | None Available | |
| Odom Larry J | $136,000 | -- | |
| Household Bank Fsb | $126,700 | -- | |
| Craft James Randall | $130,000 | -- | |
| Coming Attractions Custom Built Homes | $17,000 | -- |
Source: Public Records
Mortgage History
| Date | Status | Borrower | Loan Amount |
|---|---|---|---|
| Open | Weichert Relocation Resources Inc | $152,000 |
Source: Public Records
Tax History Compared to Growth
Tax History
| Year | Tax Paid | Tax Assessment Tax Assessment Total Assessment is a certain percentage of the fair market value that is determined by local assessors to be the total taxable value of land and additions on the property. | Land | Improvement |
|---|---|---|---|---|
| 2024 | $2,474 | $105,440 | $11,200 | $94,240 |
| 2023 | $2,050 | $86,800 | $11,200 | $75,600 |
| 2022 | $1,705 | $72,560 | $11,200 | $61,360 |
| 2021 | $1,581 | $67,080 | $11,200 | $55,880 |
| 2020 | $1,578 | $66,640 | $11,200 | $55,440 |
| 2019 | $1,578 | $66,640 | $11,200 | $55,440 |
| 2018 | $1,578 | $66,640 | $11,200 | $55,440 |
| 2017 | $1,579 | $66,640 | $11,200 | $55,440 |
| 2016 | $1,582 | $66,640 | $11,200 | $55,440 |
| 2015 | $1,585 | $66,640 | $11,200 | $55,440 |
| 2014 | -- | $66,640 | $11,200 | $55,440 |
| 2013 | -- | $64,440 | $11,200 | $53,240 |
Source: Public Records
Map
Nearby Homes
- 101 Pond Dr
- 204 Weeping Moss Way
- 135 Pond Dr
- 231 Grove Ln
- 2006 Melrose Place
- 119 Richfield Cir
- 527 Bristleleaf Path
- 117 Black Birch Ln
- 115 Black Birch Ln
- 102 Emberwood Dr
- 200 Emberwood Way
- 102 Emberwood Way
- 206 Emberwood Way
- 105 Cabin Cove Dr
- 104 Cloverdale Dr
- 108 Cloverdale Dr
- 2403 Ga Hwy 127
- 216 Hearthwood Dr
- 105 Spring Chase Cir
- 323 Haywood Dr