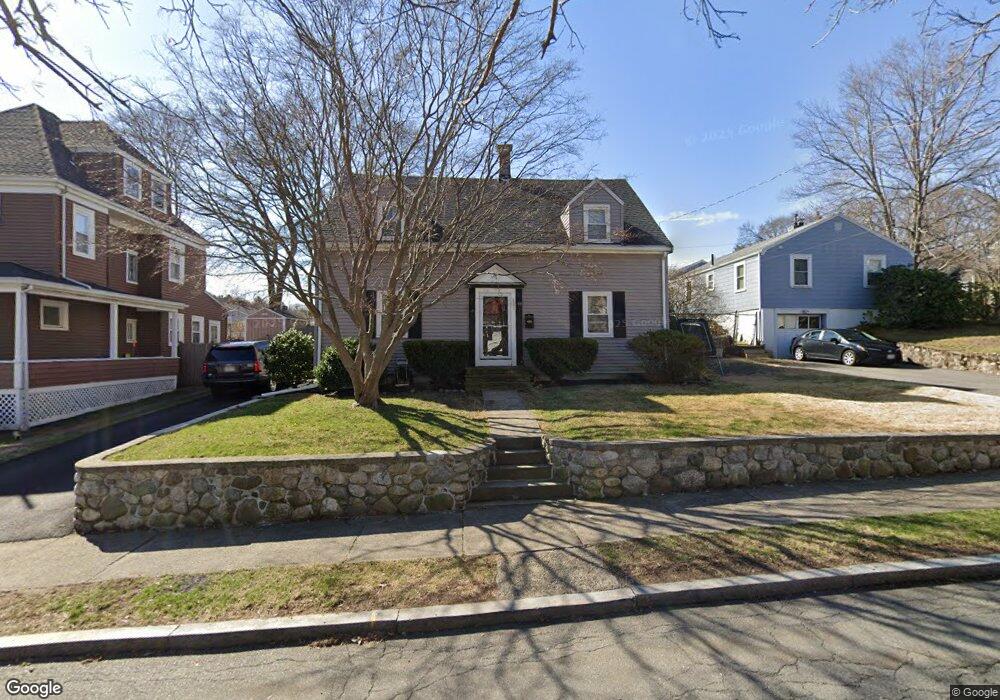
403 Grove St Melrose, MA 02176
Mount Hood NeighborhoodEstimated Value: $930,556 - $1,022,000
4
Beds
3
Baths
2,387
Sq Ft
$411/Sq Ft
Est. Value
About This Home
This home is located at 403 Grove St, Melrose, MA 02176 and is currently estimated at $981,639, approximately $411 per square foot. 403 Grove St is a home located in Middlesex County with nearby schools including Winthrop Elementary School, Hoover Elementary School, and Lincoln Elementary School.
Ownership History
Date
Name
Owned For
Owner Type
Purchase Details
Closed on
Jun 7, 2018
Sold by
Hitchman Stacy
Bought by
Stacy A Hitchman Ret
Current Estimated Value
Purchase Details
Closed on
Oct 11, 2016
Sold by
Hitchman Stacy and Hitchman David
Bought by
Hitchman Stacy
Purchase Details
Closed on
Aug 2, 2004
Sold by
Falzone Maureen
Bought by
Hitchman David and Hitchman Stacy
Home Financials for this Owner
Home Financials are based on the most recent Mortgage that was taken out on this home.
Original Mortgage
$371,200
Interest Rate
6.33%
Mortgage Type
Purchase Money Mortgage
Purchase Details
Closed on
Aug 14, 1989
Sold by
Mccarthy Robert E
Bought by
Falzone Maureen
Home Financials for this Owner
Home Financials are based on the most recent Mortgage that was taken out on this home.
Original Mortgage
$120,000
Interest Rate
9.93%
Mortgage Type
Purchase Money Mortgage
Create a Home Valuation Report for This Property
The Home Valuation Report is an in-depth analysis detailing your home's value as well as a comparison with similar homes in the area
Home Values in the Area
Average Home Value in this Area
Purchase History
| Date | Buyer | Sale Price | Title Company |
|---|---|---|---|
| Stacy A Hitchman Ret | -- | -- | |
| Hitchman Stacy | -- | -- | |
| Hitchman David | $464,000 | -- | |
| Falzone Maureen | $183,000 | -- |
Source: Public Records
Mortgage History
| Date | Status | Borrower | Loan Amount |
|---|---|---|---|
| Previous Owner | Hitchman David | $371,200 | |
| Previous Owner | Falzone Maureen | $120,000 | |
| Previous Owner | Falzone Maureen | $23,000 |
Source: Public Records
Tax History Compared to Growth
Tax History
| Year | Tax Paid | Tax Assessment Tax Assessment Total Assessment is a certain percentage of the fair market value that is determined by local assessors to be the total taxable value of land and additions on the property. | Land | Improvement |
|---|---|---|---|---|
| 2025 | $75 | $758,600 | $429,300 | $329,300 |
| 2024 | $7,148 | $719,800 | $401,600 | $318,200 |
| 2023 | $7,008 | $672,600 | $373,900 | $298,700 |
| 2022 | $6,800 | $643,300 | $360,000 | $283,300 |
| 2021 | $6,640 | $606,400 | $346,200 | $260,200 |
| 2020 | $6,395 | $578,700 | $318,500 | $260,200 |
| 2019 | $5,806 | $537,100 | $304,600 | $232,500 |
| 2018 | $5,497 | $485,200 | $252,700 | $232,500 |
| 2017 | $5,384 | $456,300 | $242,300 | $214,000 |
| 2016 | $5,116 | $414,900 | $214,600 | $200,300 |
| 2015 | $5,074 | $391,500 | $214,600 | $176,900 |
| 2014 | $4,969 | $374,200 | $197,300 | $176,900 |
Source: Public Records
Map
Nearby Homes
- 30 Wheeler Ave
- 257 1st St
- 33 Mount Hood Terrace
- 218 Upham St
- 36 Slayton Rd
- 1 Mill Rd
- 16 Plymouth Cir
- 65 Beacon St
- 42 Fairfield Ave
- 26 Magnolia Rd
- 118 N Woodcrest Dr
- 515 Upham St
- 27 Temple St
- 46 Country Club Rd
- 55 Burrell St
- 519 Essex St
- 11 Church St
- 16-18 Beacon Place
- 110 Ellis Farm Ln
- 8 Crystal St Unit 3