Estimated Value: $87,000 - $99,000
2
Beds
1
Bath
1,140
Sq Ft
$80/Sq Ft
Est. Value
About This Home
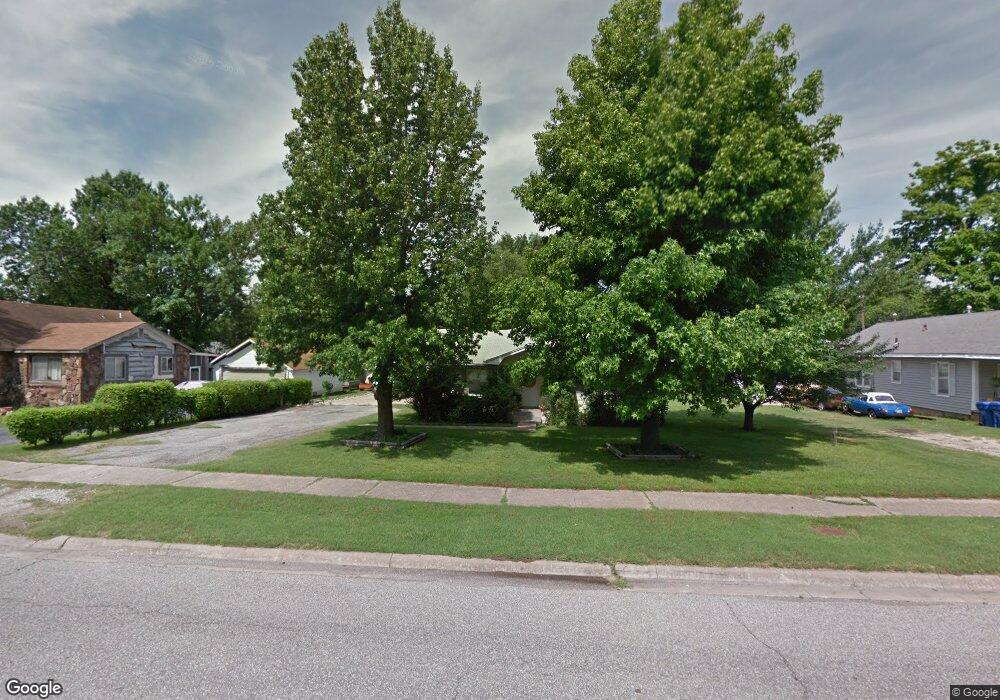
This home is located at 403 H St NW, Miami, OK 74354 and is currently estimated at $90,935, approximately $79 per square foot. 403 H St NW is a home located in Ottawa County with nearby schools including Miami High School and Mt. Olive Lutheran School.
Ownership History
Date
Name
Owned For
Owner Type
Purchase Details
Closed on
May 14, 2010
Sold by
Pierce C Jerry and Pierce Cherry A
Bought by
Harry Vicky N
Current Estimated Value
Purchase Details
Closed on
Dec 29, 2004
Bought by
Jerry Pierce C and Jerry Jerry
Purchase Details
Closed on
Feb 19, 2004
Bought by
Paynter Joy L
Purchase Details
Closed on
Nov 5, 2003
Bought by
Sec Of Housing & Urban
Purchase Details
Closed on
Nov 27, 2000
Bought by
Brown Michael and Brown Jody
Purchase Details
Closed on
Aug 27, 1993
Bought by
Boswell David and Boswell Mary A
Create a Home Valuation Report for This Property
The Home Valuation Report is an in-depth analysis detailing your home's value as well as a comparison with similar homes in the area
Home Values in the Area
Average Home Value in this Area
Purchase History
| Date | Buyer | Sale Price | Title Company |
|---|---|---|---|
| Harry Vicky N | -- | None Available | |
| Jerry Pierce C | $35,000 | -- | |
| Paynter Joy L | -- | -- | |
| Sec Of Housing & Urban | -- | -- | |
| Brown Michael | $43,500 | -- | |
| Boswell David | $24,000 | -- |
Source: Public Records
Tax History Compared to Growth
Tax History
| Year | Tax Paid | Tax Assessment Tax Assessment Total Assessment is a certain percentage of the fair market value that is determined by local assessors to be the total taxable value of land and additions on the property. | Land | Improvement |
|---|---|---|---|---|
| 2025 | $316 | $4,401 | $418 | $3,983 |
| 2024 | $316 | $4,273 | $406 | $3,867 |
| 2023 | $316 | $4,149 | $399 | $3,750 |
| 2022 | $280 | $4,028 | $399 | $3,629 |
| 2021 | $275 | $3,911 | $399 | $3,512 |
| 2020 | $267 | $3,797 | $399 | $3,398 |
| 2019 | $221 | $3,686 | $399 | $3,287 |
| 2018 | $213 | $3,579 | $399 | $3,180 |
| 2017 | $208 | $3,475 | $399 | $3,076 |
| 2016 | $191 | $3,374 | $399 | $2,975 |
| 2015 | $355 | $3,990 | $599 | $3,391 |
| 2014 | $179 | $3,181 | $679 | $2,502 |
Source: Public Records
Map
Nearby Homes