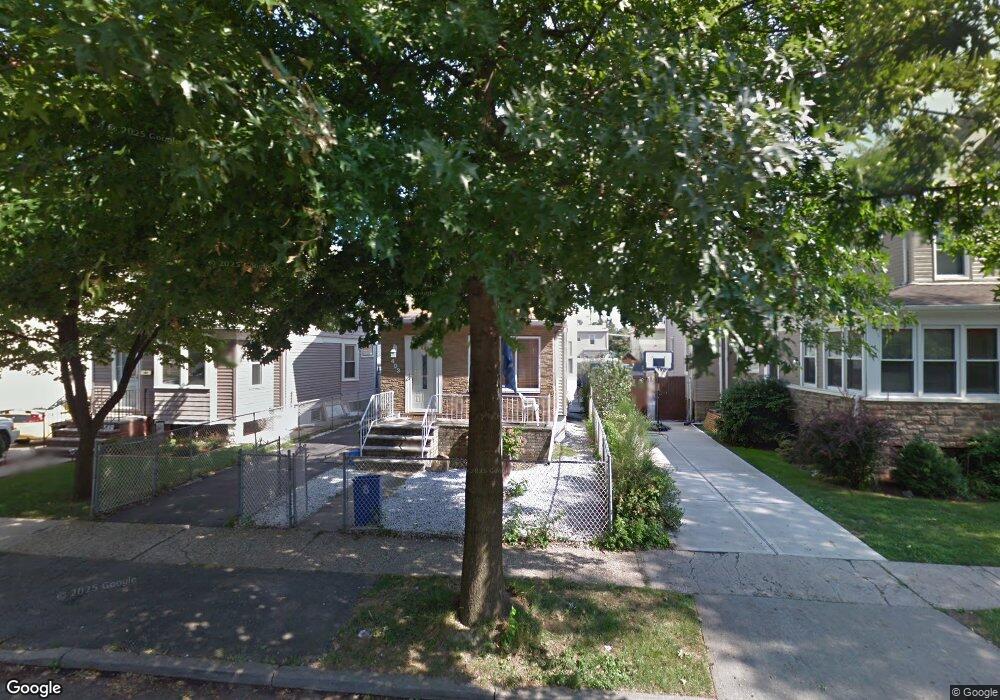
403 Heberton Ave Staten Island, NY 10302
Port Richmond NeighborhoodEstimated Value: $597,000 - $659,463
3
Beds
3
Baths
1,710
Sq Ft
$369/Sq Ft
Est. Value
About This Home
This home is located at 403 Heberton Ave, Staten Island, NY 10302 and is currently estimated at $631,116, approximately $369 per square foot. 403 Heberton Ave is a home located in Richmond County with nearby schools including P.S. 22 Graniteville, I.S. 51 Edwin Markham, and Port Richmond High School.
Ownership History
Date
Name
Owned For
Owner Type
Purchase Details
Closed on
Dec 21, 2001
Sold by
Gorman Robert E
Bought by
Dwyer Thomas
Current Estimated Value
Home Financials for this Owner
Home Financials are based on the most recent Mortgage that was taken out on this home.
Original Mortgage
$164,000
Interest Rate
7.01%
Purchase Details
Closed on
Apr 26, 2000
Sold by
Amatulli Frank
Bought by
Gorman Robert E
Home Financials for this Owner
Home Financials are based on the most recent Mortgage that was taken out on this home.
Original Mortgage
$168,096
Interest Rate
8.1%
Mortgage Type
VA
Purchase Details
Closed on
Aug 1, 1996
Sold by
Cahalane Thomas J and Cahalane Julie A
Bought by
Amatulli Frank
Home Financials for this Owner
Home Financials are based on the most recent Mortgage that was taken out on this home.
Original Mortgage
$127,200
Interest Rate
8.08%
Create a Home Valuation Report for This Property
The Home Valuation Report is an in-depth analysis detailing your home's value as well as a comparison with similar homes in the area
Home Values in the Area
Average Home Value in this Area
Purchase History
| Date | Buyer | Sale Price | Title Company |
|---|---|---|---|
| Dwyer Thomas | $205,000 | First American Title Ins Co | |
| Gorman Robert E | $170,000 | -- | |
| Amatulli Frank | $134,000 | -- |
Source: Public Records
Mortgage History
| Date | Status | Borrower | Loan Amount |
|---|---|---|---|
| Previous Owner | Dwyer Thomas | $164,000 | |
| Previous Owner | Gorman Robert E | $168,096 | |
| Previous Owner | Amatulli Frank | $127,200 |
Source: Public Records
Tax History Compared to Growth
Tax History
| Year | Tax Paid | Tax Assessment Tax Assessment Total Assessment is a certain percentage of the fair market value that is determined by local assessors to be the total taxable value of land and additions on the property. | Land | Improvement |
|---|---|---|---|---|
| 2025 | $5,256 | $37,620 | $7,643 | $29,977 |
| 2024 | $5,268 | $34,680 | $7,823 | $26,857 |
| 2023 | $5,054 | $26,284 | $6,746 | $19,538 |
| 2022 | $4,666 | $31,200 | $9,840 | $21,360 |
| 2021 | $4,894 | $32,880 | $9,840 | $23,040 |
| 2020 | $4,858 | $31,620 | $9,840 | $21,780 |
| 2019 | $4,513 | $31,320 | $9,840 | $21,480 |
| 2018 | $4,167 | $21,903 | $9,140 | $12,763 |
| 2017 | $3,915 | $20,676 | $9,189 | $11,487 |
| 2016 | $3,804 | $20,580 | $9,840 | $10,740 |
| 2015 | $3,369 | $20,292 | $7,056 | $13,236 |
| 2014 | $3,369 | $19,146 | $7,147 | $11,999 |
Source: Public Records
Map
Nearby Homes
- 30 Decker Ave
- 83 Palmer Ave
- 28 Clinton Place
- 28 Lexington Ave
- 471 Heberton Ave
- 125 Decker Ave
- 25 Lexington Ave
- 469 Port Richmond Ave
- 152 Cortlandt St
- 155 Cortlandt St
- 21 Dryden Ct
- 47 Montell St
- 94 Catherine St
- 286 Jewett Ave
- 46 Catherine St
- 322 Jewett Ave
- 859 Post Ave
- 145 Clinton Place
- 1422 Castleton Ave
- 1418 Castleton Ave
- 399 Heberton Ave
- 413 Heberton Ave
- 395 Heberton Ave
- 415 Heberton Ave
- 393 Heberton Ave Unit 66
- 421 Heberton Ave
- 391 Heberton Ave
- 64 Decker Ave Unit 66
- 70 Decker Ave
- 387 Heberton Ave
- 64-66 Decker Ave
- 423 Heberton Ave
- 72 Decker Ave
- 404 Heberton Ave
- 406 Heberton Ave
- 402 Heberton Ave
- 408 Heberton Ave
- 76 Decker Ave
- 400 Heberton Ave
- 62 Decker Ave