Estimated Value: $507,000 - $549,000
4
Beds
3
Baths
3,239
Sq Ft
$162/Sq Ft
Est. Value
About This Home
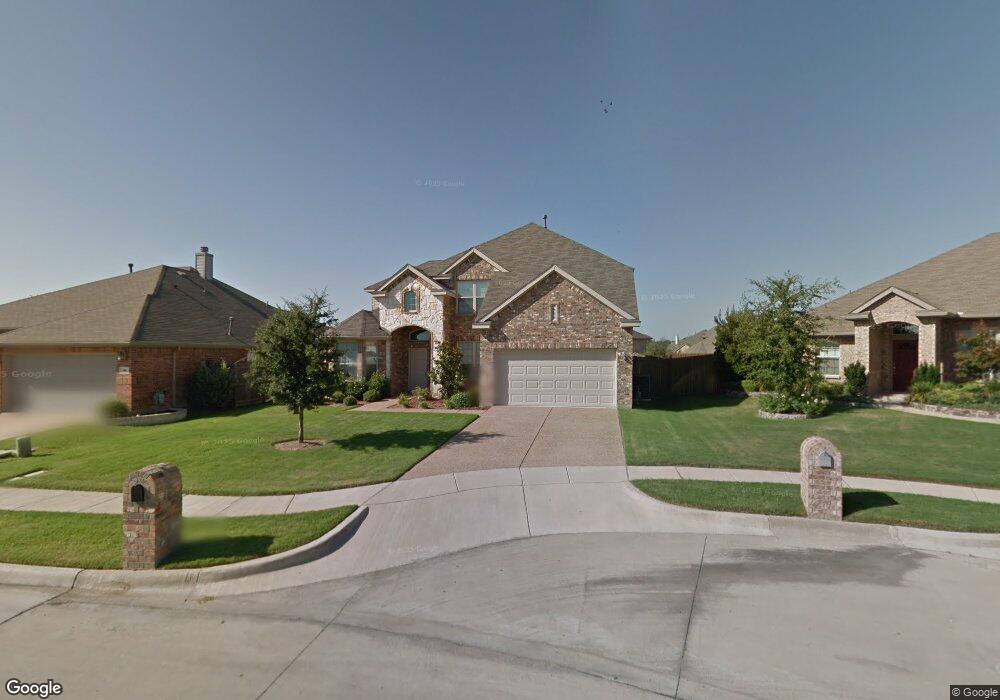
This home is located at 403 Highland View Dr, Wylie, TX 75098 and is currently estimated at $526,135, approximately $162 per square foot. 403 Highland View Dr is a home located in Collin County with nearby schools including Cheri Cox Elementary School, AB Harrison Intermediate School, and Grady Burnett J High School.
Ownership History
Date
Name
Owned For
Owner Type
Purchase Details
Closed on
Aug 17, 2012
Sold by
Phelan Marc and Phelan Gloria B
Bought by
Eldridge Emily Diane and Eldridge Robert Anthony
Current Estimated Value
Home Financials for this Owner
Home Financials are based on the most recent Mortgage that was taken out on this home.
Original Mortgage
$187,520
Outstanding Balance
$129,661
Interest Rate
3.63%
Mortgage Type
New Conventional
Estimated Equity
$396,475
Purchase Details
Closed on
Oct 29, 2009
Sold by
K Hovnanian Homes Dfw Llc
Bought by
Phelan Marc and Phelan Gloria B
Home Financials for this Owner
Home Financials are based on the most recent Mortgage that was taken out on this home.
Original Mortgage
$236,060
Interest Rate
5.05%
Mortgage Type
FHA
Create a Home Valuation Report for This Property
The Home Valuation Report is an in-depth analysis detailing your home's value as well as a comparison with similar homes in the area
Home Values in the Area
Average Home Value in this Area
Purchase History
| Date | Buyer | Sale Price | Title Company |
|---|---|---|---|
| Eldridge Emily Diane | -- | Ctot | |
| Phelan Marc | -- | Hft |
Source: Public Records
Mortgage History
| Date | Status | Borrower | Loan Amount |
|---|---|---|---|
| Open | Eldridge Emily Diane | $187,520 | |
| Previous Owner | Phelan Marc | $236,060 |
Source: Public Records
Tax History Compared to Growth
Tax History
| Year | Tax Paid | Tax Assessment Tax Assessment Total Assessment is a certain percentage of the fair market value that is determined by local assessors to be the total taxable value of land and additions on the property. | Land | Improvement |
|---|---|---|---|---|
| 2025 | $7,886 | $513,117 | $125,000 | $388,168 |
| 2024 | $7,886 | $466,470 | $125,000 | $366,623 |
| 2023 | $7,886 | $424,064 | $115,000 | $375,482 |
| 2022 | $8,458 | $385,513 | $115,000 | $332,238 |
| 2021 | $8,246 | $350,466 | $75,000 | $275,466 |
| 2020 | $8,485 | $341,707 | $70,000 | $271,707 |
| 2019 | $8,893 | $338,419 | $70,000 | $268,419 |
| 2018 | $8,534 | $316,901 | $70,000 | $246,901 |
| 2017 | $8,449 | $313,726 | $70,000 | $243,726 |
| 2016 | $8,301 | $300,427 | $60,000 | $240,427 |
| 2015 | $7,009 | $271,611 | $55,000 | $216,611 |
Source: Public Records
Map
Nearby Homes
- 319 Highland View Dr
- 2014 Fairway Woods Dr
- 301 Highland Park Ln
- 308 Parke Hollow Dr
- 303 Parke Lake Dr
- 1905 Fairway Crossing Rd
- 123 Monarch Way
- 412 Highland Ridge Dr
- 528 Highland Ridge Dr
- 322 Hogue Ln
- 506 Hemlock Ct
- 102 Autumn Sage Dr
- 107 Lantana Ln
- 100 Lavender Ln
- 217 Champion
- 206 Covington Dr
- Shepherd Plan at Dominion of Pleasant Valley - 70' Homesites
- Easton Plan at Dominion of Pleasant Valley - 50' Homesites
- Haskell II Plan at Dominion of Pleasant Valley - 70' Homesites
- Humble Plan at Dominion of Pleasant Valley - 60' Homesites
- 401 Highland View Dr
- 405 Highland View Dr
- 2107 Fairway Winds Ct
- 2105 Fairway Winds Ct
- 2010 Fairway Bend Dr
- 2013 Fairway Bend Dr
- 2103 Fairway Winds Ct
- 2101 Fairway Winds Ct
- 331 Highland View Dr
- 330 Highland Glen Dr
- 2109 Fairway Winds Ct
- 2011 Fairway Bend Dr
- 2015 Fairway Winds Ct
- 329 Highland View Dr
- 2013 Fairway Winds Ct
- 328 Highland Glen Dr
- 2014 Lake Highlands Dr
- 2009 Fairway Bend Dr
- 2006 Fairway Bend Dr
- 335 Highland Glen Dr