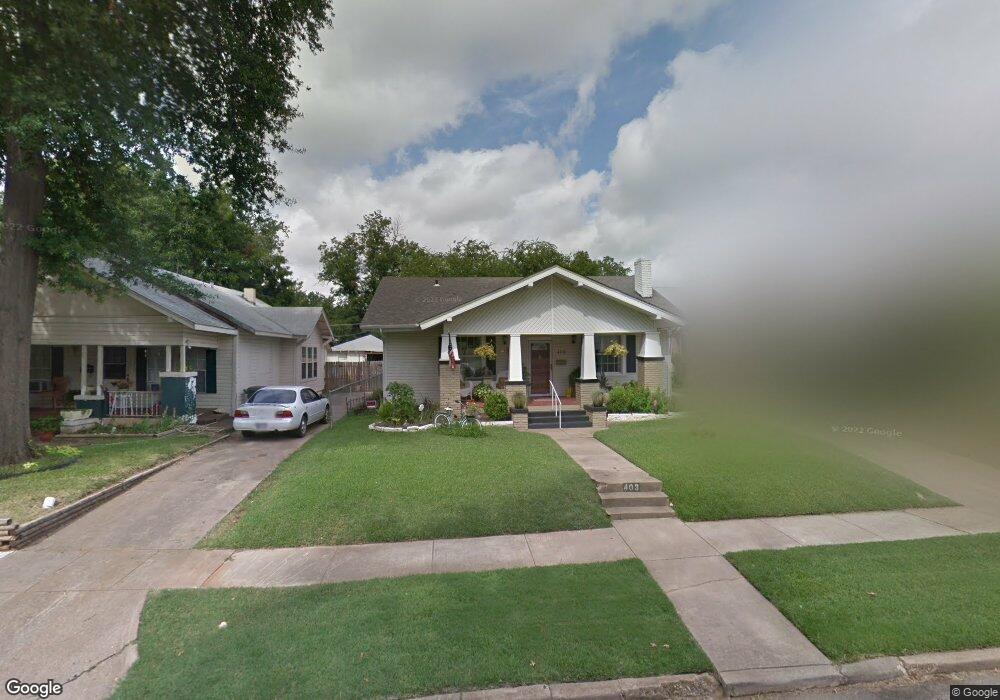
403 I St SW Ardmore, OK 73401
Estimated Value: $172,000 - $188,000
3
Beds
2
Baths
1,855
Sq Ft
$96/Sq Ft
Est. Value
About This Home
This home is located at 403 I St SW, Ardmore, OK 73401 and is currently estimated at $178,378, approximately $96 per square foot. 403 I St SW is a home located in Carter County with nearby schools including Lincoln Elementary School, Ardmore Middle School, and Ardmore High School.
Ownership History
Date
Name
Owned For
Owner Type
Purchase Details
Closed on
May 31, 2007
Sold by
Hughes Glenn A and Hughes Rose Ann
Bought by
Andrews Shaun M
Current Estimated Value
Home Financials for this Owner
Home Financials are based on the most recent Mortgage that was taken out on this home.
Original Mortgage
$83,200
Outstanding Balance
$50,799
Interest Rate
6.15%
Mortgage Type
New Conventional
Estimated Equity
$127,579
Purchase Details
Closed on
May 3, 2005
Sold by
Priddy Kirk Allen and Priddy Kirk A
Bought by
Hughes Glenn A and Hughes Rose Ann
Home Financials for this Owner
Home Financials are based on the most recent Mortgage that was taken out on this home.
Original Mortgage
$48,450
Interest Rate
6.06%
Mortgage Type
Unknown
Purchase Details
Closed on
Jan 19, 1993
Sold by
Douglass Mark L
Bought by
Priddy Kirk Allen
Create a Home Valuation Report for This Property
The Home Valuation Report is an in-depth analysis detailing your home's value as well as a comparison with similar homes in the area
Home Values in the Area
Average Home Value in this Area
Purchase History
| Date | Buyer | Sale Price | Title Company |
|---|---|---|---|
| Andrews Shaun M | $104,000 | -- | |
| Hughes Glenn A | $51,000 | -- | |
| Priddy Kirk Allen | $24,500 | -- |
Source: Public Records
Mortgage History
| Date | Status | Borrower | Loan Amount |
|---|---|---|---|
| Open | Andrews Shaun M | $83,200 | |
| Previous Owner | Hughes Glenn A | $48,450 |
Source: Public Records
Tax History Compared to Growth
Tax History
| Year | Tax Paid | Tax Assessment Tax Assessment Total Assessment is a certain percentage of the fair market value that is determined by local assessors to be the total taxable value of land and additions on the property. | Land | Improvement |
|---|---|---|---|---|
| 2024 | $1,515 | $15,703 | $1,800 | $13,903 |
| 2023 | $1,468 | $15,246 | $1,800 | $13,446 |
| 2022 | $1,319 | $14,802 | $1,800 | $13,002 |
| 2021 | $1,349 | $14,371 | $1,800 | $12,571 |
| 2020 | $1,288 | $13,952 | $1,800 | $12,152 |
| 2019 | $1,243 | $13,798 | $1,724 | $12,074 |
| 2018 | $1,224 | $13,396 | $1,200 | $12,196 |
| 2017 | $1,137 | $13,433 | $1,200 | $12,233 |
| 2016 | $1,038 | $12,135 | $1,200 | $10,935 |
| 2015 | $837 | $11,891 | $1,872 | $10,019 |
| 2014 | $1,094 | $13,222 | $955 | $12,267 |
Source: Public Records
Map
Nearby Homes