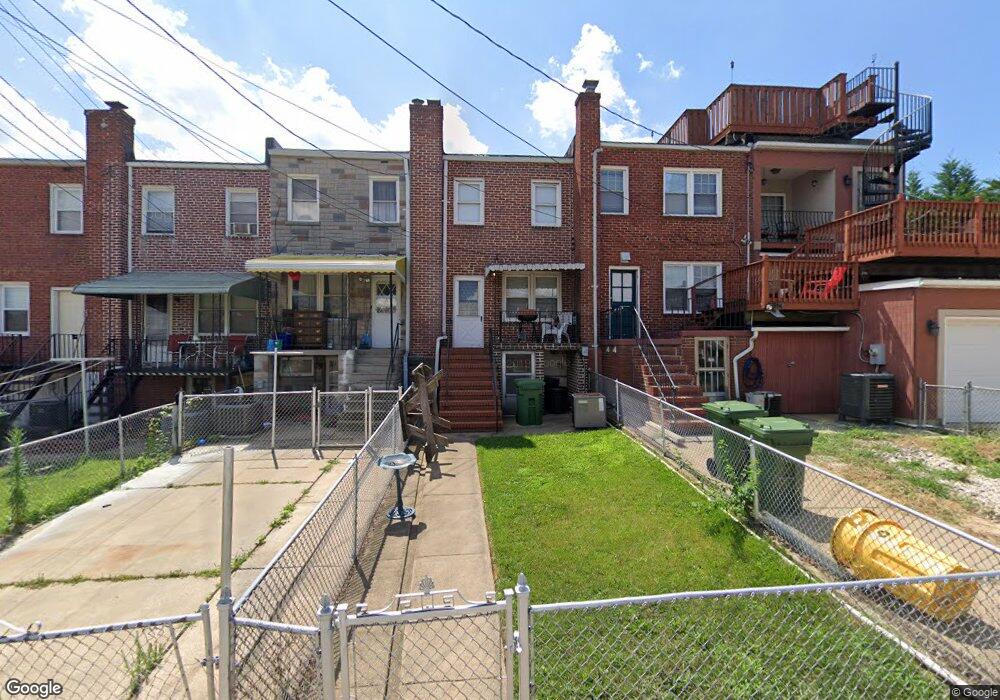
403 Imla St Baltimore, MD 21224
Bayview NeighborhoodEstimated Value: $123,000 - $151,977
Studio
1
Bath
840
Sq Ft
$164/Sq Ft
Est. Value
About This Home
This home is located at 403 Imla St, Baltimore, MD 21224 and is currently estimated at $137,489, approximately $163 per square foot. 403 Imla St is a home located in Baltimore City with nearby schools including Graceland Park-O'Donnell Heights Elementary/Middle School, Booker T. Washington Middle School, and Patterson High School.
Ownership History
Date
Name
Owned For
Owner Type
Purchase Details
Closed on
Dec 28, 2006
Sold by
Heath John J
Bought by
Cheek Andrea
Current Estimated Value
Home Financials for this Owner
Home Financials are based on the most recent Mortgage that was taken out on this home.
Original Mortgage
$2,000
Interest Rate
6.28%
Mortgage Type
Unknown
Purchase Details
Closed on
Mar 31, 2000
Sold by
Heath John J
Bought by
Cheek Andrea
Home Financials for this Owner
Home Financials are based on the most recent Mortgage that was taken out on this home.
Original Mortgage
$49,492
Interest Rate
8.26%
Mortgage Type
Purchase Money Mortgage
Create a Home Valuation Report for This Property
The Home Valuation Report is an in-depth analysis detailing your home's value as well as a comparison with similar homes in the area
Home Values in the Area
Average Home Value in this Area
Purchase History
| Date | Buyer | Sale Price | Title Company |
|---|---|---|---|
| Cheek Andrea | $49,900 | -- | |
| Cheek Andrea | $49,900 | -- |
Source: Public Records
Mortgage History
| Date | Status | Borrower | Loan Amount |
|---|---|---|---|
| Closed | Cheek Andrea | $2,000 | |
| Open | Cheek Andrea | $49,492 | |
| Previous Owner | Cheek Andrea | $49,492 |
Source: Public Records
Tax History
| Year | Tax Paid | Tax Assessment Tax Assessment Total Assessment is a certain percentage of the fair market value that is determined by local assessors to be the total taxable value of land and additions on the property. | Land | Improvement |
|---|---|---|---|---|
| 2025 | $1,956 | $109,600 | $25,000 | $84,600 |
| 2024 | $1,956 | $101,467 | -- | -- |
| 2023 | $2,096 | $93,333 | $0 | $0 |
| 2022 | $2,011 | $85,200 | $25,000 | $60,200 |
| 2021 | $2,011 | $85,200 | $25,000 | $60,200 |
| 2020 | $1,840 | $85,200 | $25,000 | $60,200 |
| 2019 | $1,889 | $88,000 | $25,000 | $63,000 |
| 2018 | $1,902 | $87,267 | $0 | $0 |
| 2017 | $1,905 | $86,533 | $0 | $0 |
| 2016 | $1,806 | $85,800 | $0 | $0 |
| 2015 | $1,806 | $85,800 | $0 | $0 |
| 2014 | $1,806 | $85,800 | $0 | $0 |
Source: Public Records
Map
Nearby Homes
Your Personal Tour Guide
Ask me questions while you tour the home.