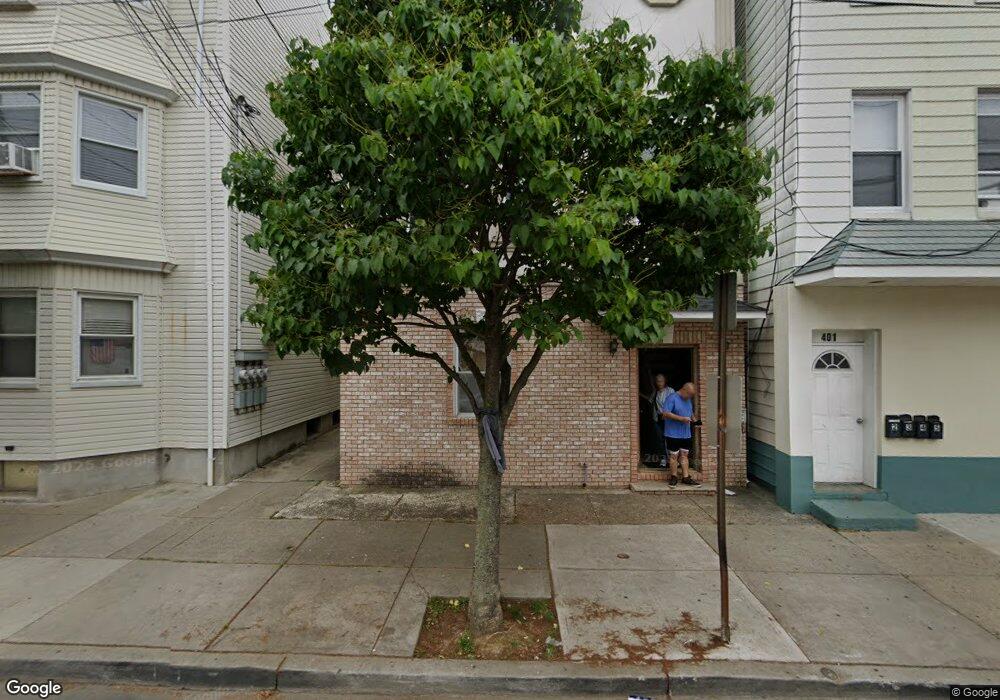
403 John St East Newark, NJ 07029
Estimated Value: $626,000 - $826,000
Studio
--
Bath
3,192
Sq Ft
$233/Sq Ft
Est. Value
About This Home
This home is located at 403 John St, East Newark, NJ 07029 and is currently estimated at $742,337, approximately $232 per square foot. 403 John St is a home located in Hudson County with nearby schools including East Newark Public School, Kearny Christian Academy, and Marwah Academy.
Ownership History
Date
Name
Owned For
Owner Type
Purchase Details
Closed on
Apr 9, 2008
Sold by
Munley Thomas
Bought by
Silva Licinio
Current Estimated Value
Home Financials for this Owner
Home Financials are based on the most recent Mortgage that was taken out on this home.
Original Mortgage
$140,000
Interest Rate
6.22%
Mortgage Type
Purchase Money Mortgage
Purchase Details
Closed on
Nov 23, 1998
Sold by
Munley Theresa
Bought by
Munley Thomas
Create a Home Valuation Report for This Property
The Home Valuation Report is an in-depth analysis detailing your home's value as well as a comparison with similar homes in the area
Purchase History
| Date | Buyer | Sale Price | Title Company |
|---|---|---|---|
| Silva Licinio | $205,000 | None Available | |
| Munley Thomas | -- | -- |
Source: Public Records
Mortgage History
| Date | Status | Borrower | Loan Amount |
|---|---|---|---|
| Closed | Silva Licinio | $140,000 |
Source: Public Records
Tax History Compared to Growth
Tax History
| Year | Tax Paid | Tax Assessment Tax Assessment Total Assessment is a certain percentage of the fair market value that is determined by local assessors to be the total taxable value of land and additions on the property. | Land | Improvement |
|---|---|---|---|---|
| 2025 | $10,886 | $367,400 | $59,000 | $308,400 |
| 2024 | $10,328 | $367,400 | $59,000 | $308,400 |
Source: Public Records
Map
Nearby Homes
- 349 N 2nd St
- 351 N 2nd St
- 213 Central Ave
- 313 Central Ave
- 441 John St
- 228 Hamilton St
- 323 William St
- 607 Frank E Rodgers Blvd N
- 105 Grant Ave
- 430 Central Ave
- 310 Passaic Ave Unit 308
- 18 Patterson St
- 308 Davis Ave
- 503 Cross St
- 200 Dey St Unit 260
- 200 Dey St Unit 262
- 200 Dey St Unit 266
- 133 Sussex St
- 118 Maple St
- 10 Devon Terrace