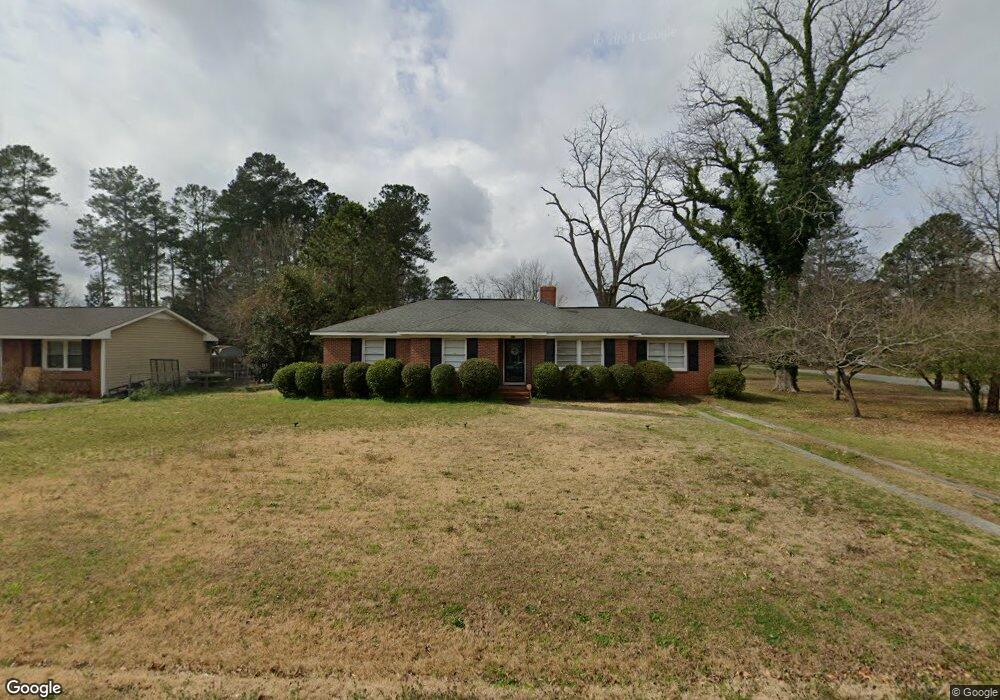
403 Johns Rd Thomson, GA 30824
Estimated Value: $174,220 - $199,000
3
Beds
2
Baths
1,685
Sq Ft
$111/Sq Ft
Est. Value
About This Home
This home is located at 403 Johns Rd, Thomson, GA 30824 and is currently estimated at $186,740, approximately $110 per square foot. 403 Johns Rd is a home located in McDuffie County with nearby schools including Thomson High School.
Ownership History
Date
Name
Owned For
Owner Type
Purchase Details
Closed on
Mar 30, 2010
Sold by
Pirkle Phillip Bradley
Bought by
Pirkle Phillip Bradley
Current Estimated Value
Purchase Details
Closed on
May 31, 2006
Sold by
Greene James Roscoe
Bought by
Pirkle Philip Bradley
Home Financials for this Owner
Home Financials are based on the most recent Mortgage that was taken out on this home.
Original Mortgage
$93,060
Interest Rate
6.51%
Mortgage Type
New Conventional
Purchase Details
Closed on
Nov 15, 2004
Sold by
Greene James Roscoe
Bought by
Greene James Roscoe
Purchase Details
Closed on
Jul 26, 1958
Bought by
Greene Greene J and Greene Elaine
Create a Home Valuation Report for This Property
The Home Valuation Report is an in-depth analysis detailing your home's value as well as a comparison with similar homes in the area
Home Values in the Area
Average Home Value in this Area
Purchase History
| Date | Buyer | Sale Price | Title Company |
|---|---|---|---|
| Pirkle Phillip Bradley | -- | -- | |
| Pirkle Philip Bradley | $103,400 | -- | |
| Greene James Roscoe | -- | -- | |
| Greene Greene J | -- | -- |
Source: Public Records
Mortgage History
| Date | Status | Borrower | Loan Amount |
|---|---|---|---|
| Previous Owner | Pirkle Philip Bradley | $93,060 |
Source: Public Records
Tax History
| Year | Tax Paid | Tax Assessment Tax Assessment Total Assessment is a certain percentage of the fair market value that is determined by local assessors to be the total taxable value of land and additions on the property. | Land | Improvement |
|---|---|---|---|---|
| 2025 | $1,975 | $63,214 | $2,994 | $60,220 |
| 2024 | $1,975 | $60,074 | $2,907 | $57,167 |
| 2023 | $1,901 | $57,560 | $2,760 | $54,800 |
| 2022 | $1,520 | $44,208 | $2,300 | $41,908 |
| 2021 | $1,211 | $34,678 | $2,300 | $32,378 |
| 2020 | $1,296 | $36,930 | $6,998 | $29,932 |
| 2019 | $1,505 | $42,528 | $6,998 | $35,530 |
| 2018 | $1,520 | $42,528 | $6,998 | $35,530 |
| 2017 | $1,479 | $42,528 | $6,998 | $35,530 |
| 2016 | $1,489 | $42,528 | $6,998 | $35,530 |
| 2015 | $1,321 | $42,528 | $6,998 | $35,530 |
| 2014 | $1,325 | $42,528 | $6,998 | $35,530 |
| 2013 | -- | $42,528 | $6,998 | $35,530 |
Source: Public Records
Map
Nearby Homes
Your Personal Tour Guide
Ask me questions while you tour the home.