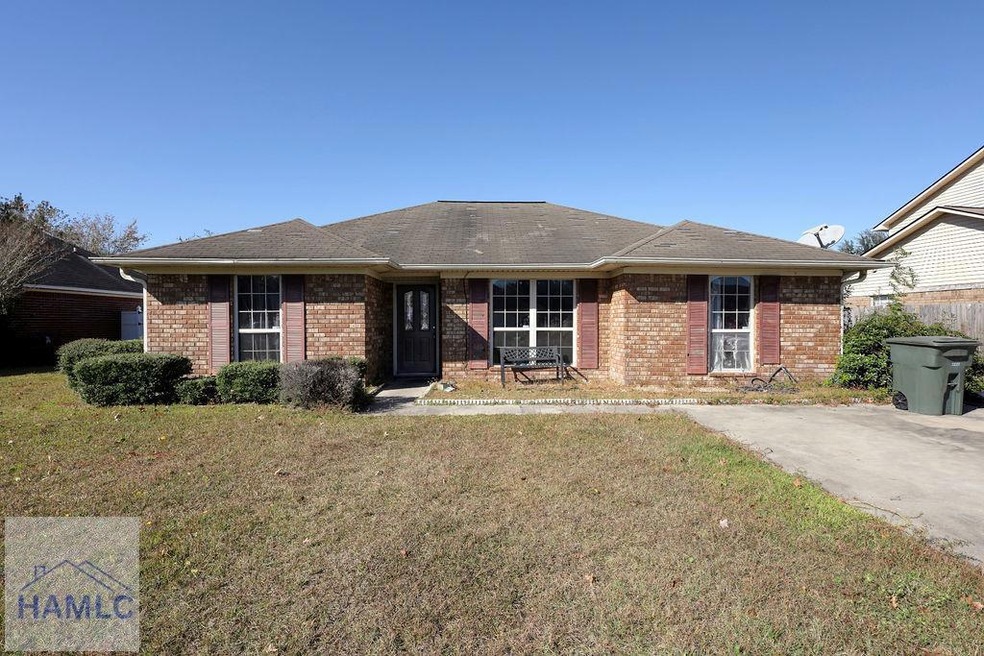
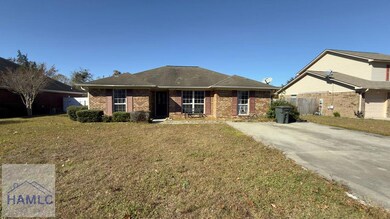
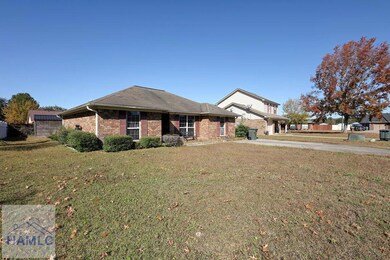
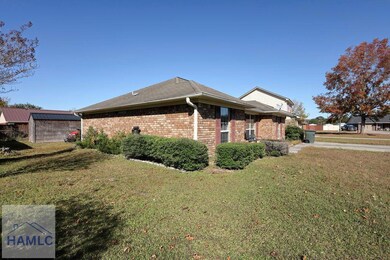
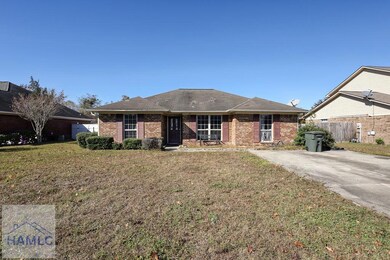
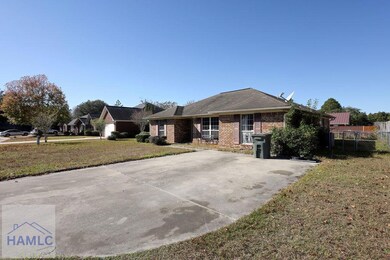
403 Lancaster Loop Hinesville, GA 31313
Estimated payment $1,231/month
Highlights
- No HOA
- Brick or Stone Mason
- Central Heating and Cooling System
- Covered Patio or Porch
- Walk-In Closet
- Combination Kitchen and Dining Room
About This Home
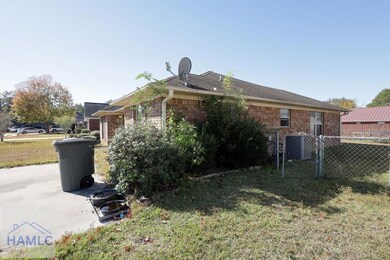
All-brick home with great potential and a functional split floor plan. The additional bedrooms are located on one side of the home, offering privacy from the primary suite on the other. The kitchen opens to the dining area, creating an easy flow for daily living. Enjoy a cozy covered back patio, perfect for relaxing or entertaining, plus an exterior storage room accessible from the patio and an additional storage shed that conveys with the property. Gutters are already installed for added convenience. This home has solid bones and plenty of opportunity to bring your vision to life!
Listing Agent
A Plus Realty Group Brokerage Email: 9124634409, www.aplusrealtygroupllc@gmail.com License #370094 Listed on: 11/08/2025
Home Details
Home Type
- Single Family
Est. Annual Taxes
- $3,683
Year Built
- 2003
Lot Details
- 8,276 Sq Ft Lot
- Partially Fenced Property
- Chain Link Fence
Home Design
- Brick or Stone Mason
- Slab Foundation
- Wood Frame Construction
- Shingle Roof
Interior Spaces
- 1,431 Sq Ft Home
- 1-Story Property
- Combination Kitchen and Dining Room
Bedrooms and Bathrooms
- 3 Bedrooms
- Walk-In Closet
- 2 Full Bathrooms
Outdoor Features
- Covered Patio or Porch
Schools
- Lyman Hall Elementary School
- Lewis Frasier Middle School
- Bradwell Institute High School
Utilities
- Central Heating and Cooling System
- Electric Water Heater
Community Details
- No Home Owners Association
- Fairington Subdivision
Listing and Financial Details
- Assessor Parcel Number 049C087
Map
Home Values in the Area
Average Home Value in this Area
Tax History
| Year | Tax Paid | Tax Assessment Tax Assessment Total Assessment is a certain percentage of the fair market value that is determined by local assessors to be the total taxable value of land and additions on the property. | Land | Improvement |
|---|---|---|---|---|
| 2024 | $3,683 | $74,977 | $14,000 | $60,977 |
| 2023 | $3,683 | $66,752 | $10,000 | $56,752 |
| 2022 | $2,403 | $51,534 | $8,000 | $43,534 |
| 2021 | $2,217 | $46,656 | $8,000 | $38,656 |
| 2020 | $2,090 | $43,551 | $8,000 | $35,551 |
| 2019 | $2,094 | $43,959 | $8,000 | $35,959 |
| 2018 | $1,931 | $40,731 | $8,000 | $32,731 |
| 2017 | $1,353 | $41,099 | $8,000 | $33,099 |
| 2016 | $1,873 | $41,467 | $8,000 | $33,467 |
| 2015 | $2,299 | $44,667 | $11,200 | $33,467 |
| 2014 | $2,299 | $50,456 | $11,200 | $39,256 |
| 2013 | -- | $46,130 | $11,200 | $34,930 |
Property History
| Date | Event | Price | List to Sale | Price per Sq Ft |
|---|---|---|---|---|
| 11/08/2025 11/08/25 | For Sale | $175,000 | -- | $122 / Sq Ft |
Purchase History
| Date | Type | Sale Price | Title Company |
|---|---|---|---|
| Warranty Deed | $128,500 | -- | |
| Deed | $123,000 | -- | |
| Deed | $114,011 | -- | |
| Deed | $90,400 | -- | |
| Deed | -- | -- |
Mortgage History
| Date | Status | Loan Amount | Loan Type |
|---|---|---|---|
| Open | $131,262 | VA | |
| Previous Owner | $125,644 | VA |
Source: Hinesville Area Board of REALTORS®
MLS Number: 163700
APN: 049C-087
- 316 Clairemore Cir
- 170 Wayfair Ln
- 186 Wayfair Ln
- 205 Bridgemont Way
- 311 Kevin Rd
- 401 Barry McCaffrey Blvd Unit E1
- 401 Barry McCaffrey Blvd Unit C3
- 401 Barry McCaffrey Blvd Unit K2
- 218 Kevin Rd
- 315 Joann Lewis Ln
- 170 Joann Lewis Ln
- 122 Joann Lewis Ln
- 181 Kyle Ln
- 89 Salette St
- 141 Kyle Ln
- 2411 Fernando Ct
- 265 Miller St
- 2131 Walberg Dr
- 1936 Heathrow Dr
- 0 W Oglethorpe Hwy
- 418 Lancaster Loop
- 67 Rosebud Ct
- 265 Miller St
- 179 Crosby Dr
- 116 Mattie St
- 15 Belleau Woods Cir
- 57 Belleau Woods Cir
- 1308 Tower Dr
- 1134 Kelly Dr Unit 43
- 1134 Kelly Dr Unit 6
- 1134 Kelly Dr Unit 64
- 1616 Seneca Ln
- 1758 Ashton Dr
- 180 Waters Ave
- 216 S Topi Trail
- 18 St Johns Ct
- 248 S Topi Trail
- 1429 Evergreen Trail
- 1106 Ricade Dr
- 1065 Kelly Dr
