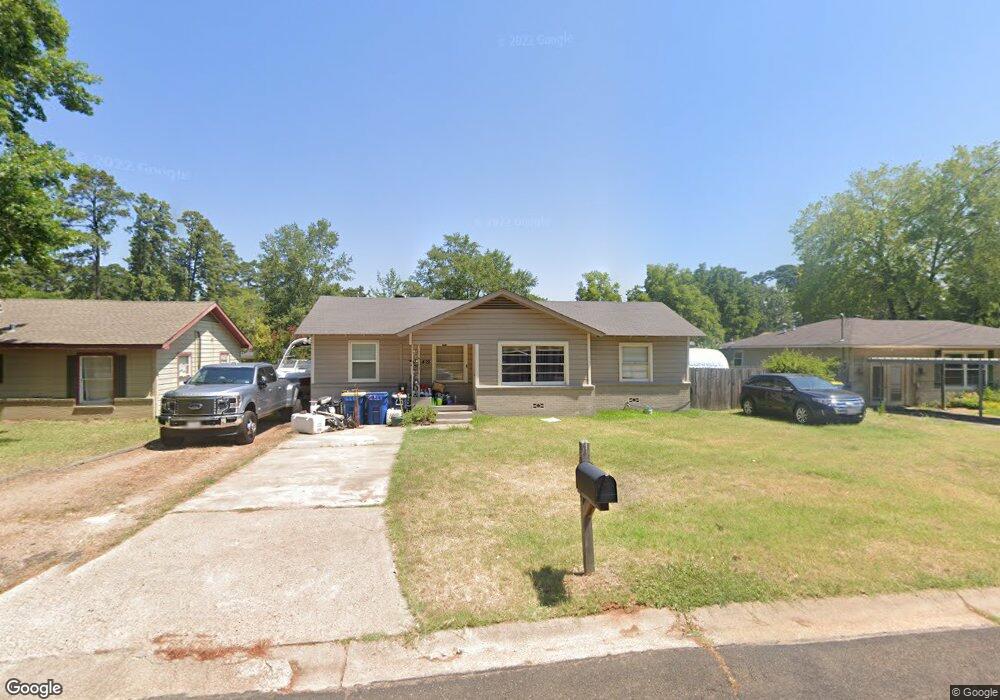
403 Layton St Kilgore, TX 75662
Estimated Value: $155,331 - $182,000
--
Bed
--
Bath
1,486
Sq Ft
$115/Sq Ft
Est. Value
About This Home
This home is located at 403 Layton St, Kilgore, TX 75662 and is currently estimated at $171,583, approximately $115 per square foot. 403 Layton St is a home located in Rusk County with nearby schools including Kilgore Primary School, Chandler Elementary School, and Kilgore Intermediate School.
Ownership History
Date
Name
Owned For
Owner Type
Purchase Details
Closed on
Apr 28, 2021
Sold by
Moore Jeremy and Moore Jessica
Bought by
Hopper Brandy Christopher and Hopper Laura Ann
Current Estimated Value
Purchase Details
Closed on
Jan 29, 2021
Sold by
Simpson Ricky J and Simpson Penny Gay
Bought by
Hopper Brandy and Hopper Laura
Purchase Details
Closed on
Nov 5, 2008
Sold by
Lara Juan
Bought by
Hopper Brandy and Hopper Loya
Home Financials for this Owner
Home Financials are based on the most recent Mortgage that was taken out on this home.
Original Mortgage
$96,390
Interest Rate
6.18%
Mortgage Type
New Conventional
Purchase Details
Closed on
Jul 29, 2004
Sold by
Osullivan John D and Osullivan Nancy A Warren
Bought by
Lara Juan
Home Financials for this Owner
Home Financials are based on the most recent Mortgage that was taken out on this home.
Original Mortgage
$76,794
Interest Rate
5.61%
Mortgage Type
FHA
Create a Home Valuation Report for This Property
The Home Valuation Report is an in-depth analysis detailing your home's value as well as a comparison with similar homes in the area
Home Values in the Area
Average Home Value in this Area
Purchase History
| Date | Buyer | Sale Price | Title Company |
|---|---|---|---|
| Hopper Brandy Christopher | -- | None Available | |
| Hopper Brandy | -- | None Available | |
| Hopper Brandy | -- | None Available | |
| Hopper Brandy | -- | -- | |
| Lara Juan | -- | -- |
Source: Public Records
Mortgage History
| Date | Status | Borrower | Loan Amount |
|---|---|---|---|
| Previous Owner | Hopper Brandy | $96,390 | |
| Previous Owner | Lara Juan | $76,794 |
Source: Public Records
Tax History Compared to Growth
Tax History
| Year | Tax Paid | Tax Assessment Tax Assessment Total Assessment is a certain percentage of the fair market value that is determined by local assessors to be the total taxable value of land and additions on the property. | Land | Improvement |
|---|---|---|---|---|
| 2024 | $3,253 | $135,610 | $25,000 | $110,610 |
| 2023 | $2,913 | $138,630 | $20,000 | $118,630 |
| 2022 | $2,929 | $115,410 | $8,000 | $107,410 |
| 2021 | $2,486 | $97,870 | $8,000 | $89,870 |
| 2020 | $2,487 | $97,870 | $8,000 | $89,870 |
| 2019 | $2,550 | $97,870 | $8,000 | $89,870 |
| 2018 | $2,609 | $97,870 | $8,000 | $89,870 |
| 2017 | $2,519 | $97,870 | $8,000 | $89,870 |
| 2016 | $2,519 | $97,870 | $8,000 | $89,870 |
| 2015 | -- | $97,870 | $8,000 | $89,870 |
| 2014 | -- | $93,260 | $8,000 | $85,260 |
Source: Public Records
Map
Nearby Homes