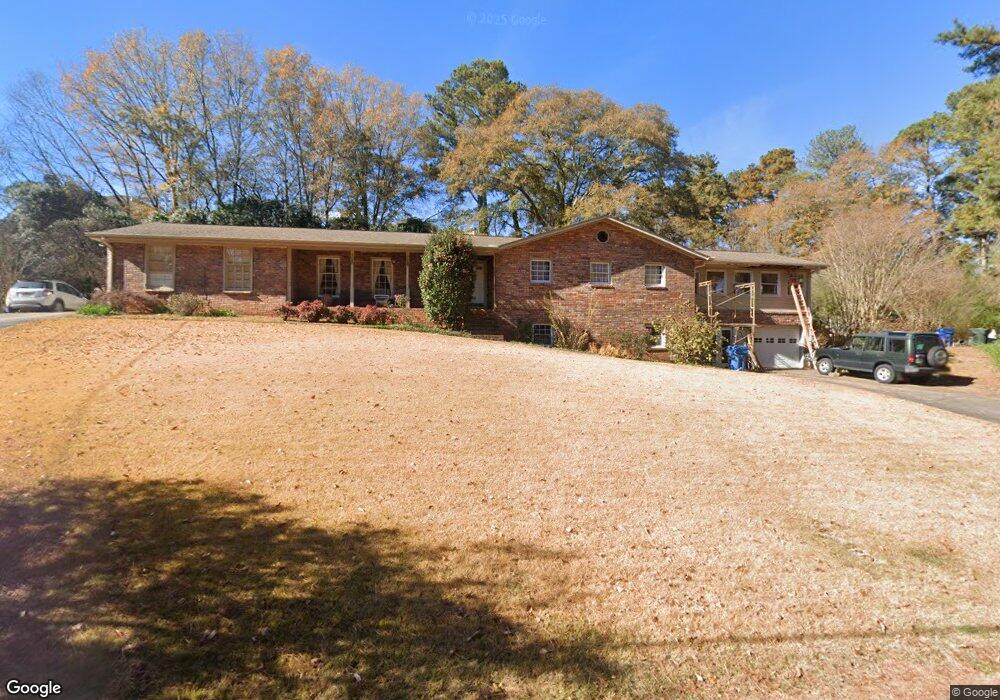
403 Lynne Cir Alpharetta, GA 30009
Estimated Value: $1,097,000 - $1,468,000
3
Beds
2
Baths
2,696
Sq Ft
$475/Sq Ft
Est. Value
About This Home
This home is located at 403 Lynne Cir, Alpharetta, GA 30009 and is currently estimated at $1,281,231, approximately $475 per square foot. 403 Lynne Cir is a home located in Fulton County with nearby schools including Alpharetta Elementary School, Hopewell Middle School, and Cambridge High School.
Ownership History
Date
Name
Owned For
Owner Type
Purchase Details
Closed on
May 13, 2024
Sold by
Brook Daniel W
Bought by
Premier Homes Ig 10 Llc
Current Estimated Value
Purchase Details
Closed on
Mar 8, 2024
Sold by
Brook Nicole Y
Bought by
Brook Daniel W
Purchase Details
Closed on
Dec 11, 2003
Sold by
Kuffrey Mocke A and Kuffrey Laura G
Bought by
Kuffrey Laura G
Home Financials for this Owner
Home Financials are based on the most recent Mortgage that was taken out on this home.
Original Mortgage
$53,035
Interest Rate
5.82%
Mortgage Type
New Conventional
Purchase Details
Closed on
Feb 11, 1999
Sold by
Cochran Dovie W
Bought by
Kuffrey Macke A and Kuffrey Laura G
Home Financials for this Owner
Home Financials are based on the most recent Mortgage that was taken out on this home.
Original Mortgage
$112,000
Interest Rate
6.79%
Mortgage Type
New Conventional
Create a Home Valuation Report for This Property
The Home Valuation Report is an in-depth analysis detailing your home's value as well as a comparison with similar homes in the area
Home Values in the Area
Average Home Value in this Area
Purchase History
| Date | Buyer | Sale Price | Title Company |
|---|---|---|---|
| Premier Homes Ig 10 Llc | $1,250,000 | -- | |
| Brook Daniel W | -- | -- | |
| Kuffrey Laura G | -- | -- | |
| Kuffrey Macke A | $162,200 | -- |
Source: Public Records
Mortgage History
| Date | Status | Borrower | Loan Amount |
|---|---|---|---|
| Previous Owner | Kuffrey Laura G | $53,035 | |
| Previous Owner | Kuffrey Macke A | $112,000 |
Source: Public Records
Tax History Compared to Growth
Tax History
| Year | Tax Paid | Tax Assessment Tax Assessment Total Assessment is a certain percentage of the fair market value that is determined by local assessors to be the total taxable value of land and additions on the property. | Land | Improvement |
|---|---|---|---|---|
| 2025 | $526 | $105,080 | $104,120 | $960 |
| 2023 | $9,676 | $342,800 | $123,400 | $219,400 |
| 2022 | $2,456 | $342,800 | $123,400 | $219,400 |
| 2021 | $2,835 | $222,360 | $40,080 | $182,280 |
| 2020 | $2,791 | $226,680 | $126,840 | $99,840 |
| 2019 | $381 | $159,160 | $33,680 | $125,480 |
| 2018 | $3,597 | $155,440 | $32,880 | $122,560 |
| 2017 | $2,122 | $84,680 | $18,840 | $65,840 |
| 2016 | $2,117 | $84,560 | $18,840 | $65,720 |
| 2015 | $2,412 | $84,560 | $18,840 | $65,720 |
| 2014 | $2,201 | $84,560 | $18,840 | $65,720 |
Source: Public Records
Map
Nearby Homes
- 1810 Broadwell Oaks Dr
- 417 Lynne Cir
- 355 Heritage Ln Unit 1
- Hillstone with Basement Plan at Emberly - Monarch Collection
- Rockmart Elite Plan at Emberly - Mariposa Collection
- Rockmart Plan at Emberly - Mariposa Collection
- Hedgewood with Basement Plan at Emberly - Monarch Collection
- Hedgewood Plan at Emberly - Monarch Collection
- Hillstone Plan at Emberly - Monarch Collection
- Rockmart Grand Plan at Emberly - Mariposa Collection
- Antoinette with Basement Plan at Emberly - Monarch Collection
- Antoinette Plan at Emberly - Monarch Collection
- 362 Mayfield Cir
- 170 Mayfield Cir
- 202 Kenneth Dr
- 326 Treble Way
- 3051 Maple Ln
- 205 Mayfield Cir
- 1320 Mayfield Manor Dr Unit 3
- 3016 Steeplechase Unit 3
- 12205 Belvoir Ln
- 368 Lynne Cir
- 389 Lynne Cir
- 12195 Belvoir Ln
- 12215 Belvoir Ln
- 130 Mayfield Cir
- 12185 Belvoir Ln
- 423 Lynne Cir
- 372 Lynne Cir
- 388 Lynne Cir
- 407 Lynne Cir
- 12200 Belvoir Ln
- 135 Mayfield Cir
- 1790 Broadwell Oaks Dr
- 381 Lynne Cir
- 1800 Broadwell Oaks Dr
- 12180 Belvoir Ln
- 12175 Belvoir Ln
- 374 Lynne Cir
- 408 Lynne Cir