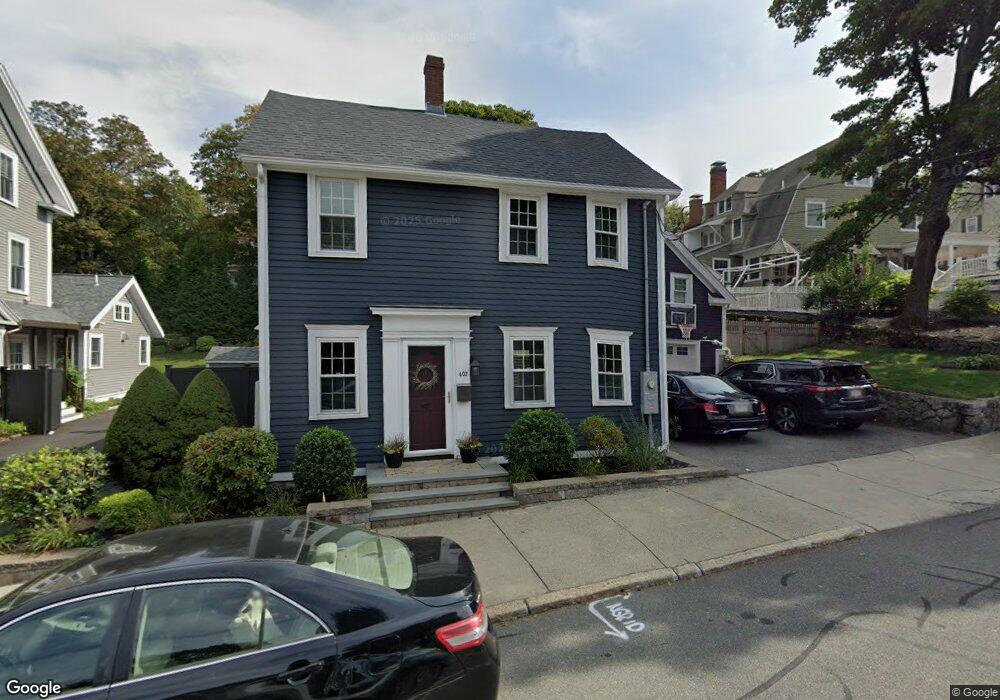
403 Main St Winchester, MA 01890
Estimated Value: $1,538,000 - $1,644,000
4
Beds
3
Baths
2,600
Sq Ft
$609/Sq Ft
Est. Value
About This Home
This home is located at 403 Main St, Winchester, MA 01890 and is currently estimated at $1,584,439, approximately $609 per square foot. 403 Main St is a home located in Middlesex County with nearby schools including Lincoln Elementary School, McCall Middle School, and Winchester High School.
Ownership History
Date
Name
Owned For
Owner Type
Purchase Details
Closed on
May 27, 2008
Sold by
Valdez Sebastian and Valdez Virginia
Bought by
Simpson Marie E and Simpson Scott A
Current Estimated Value
Purchase Details
Closed on
May 9, 2002
Sold by
Welch James
Bought by
Valdez Sebastian and Valdez Virginia
Purchase Details
Closed on
Dec 1, 2000
Sold by
Houllahan James M and Houllahan Christina A
Bought by
Welch James
Purchase Details
Closed on
May 19, 1997
Sold by
Janes Charles A and Janes Kari L
Bought by
Houllahan James M and Houllahan Christina M
Purchase Details
Closed on
Jun 2, 1992
Sold by
Ge Mtg Ins Corp
Bought by
Anderson Richard I and Anderson Susan D
Purchase Details
Closed on
Dec 23, 1991
Sold by
Murphy Patrick J
Bought by
Ge Capital Mtg Serv
Purchase Details
Closed on
Nov 3, 1989
Sold by
Connor George E
Bought by
403 Main St Rt
Create a Home Valuation Report for This Property
The Home Valuation Report is an in-depth analysis detailing your home's value as well as a comparison with similar homes in the area
Home Values in the Area
Average Home Value in this Area
Purchase History
| Date | Buyer | Sale Price | Title Company |
|---|---|---|---|
| Simpson Marie E | $827,000 | -- | |
| Valdez Sebastian | $509,000 | -- | |
| Welch James | $450,000 | -- | |
| Houllahan James M | $334,500 | -- | |
| Anderson Richard I | $210,000 | -- | |
| Ge Capital Mtg Serv | $201,500 | -- | |
| 403 Main St Rt | $170,000 | -- |
Source: Public Records
Mortgage History
| Date | Status | Borrower | Loan Amount |
|---|---|---|---|
| Open | 403 Main St Rt | $410,000 | |
| Closed | 403 Main St Rt | $414,500 |
Source: Public Records
Tax History Compared to Growth
Tax History
| Year | Tax Paid | Tax Assessment Tax Assessment Total Assessment is a certain percentage of the fair market value that is determined by local assessors to be the total taxable value of land and additions on the property. | Land | Improvement |
|---|---|---|---|---|
| 2025 | $144 | $1,301,700 | $757,200 | $544,500 |
| 2024 | $14,320 | $1,263,900 | $757,200 | $506,700 |
| 2023 | $13,681 | $1,159,400 | $666,400 | $493,000 |
| 2022 | $13,447 | $1,074,900 | $605,800 | $469,100 |
| 2021 | $12,431 | $968,900 | $499,800 | $469,100 |
| 2020 | $12,005 | $968,900 | $499,800 | $469,100 |
| 2019 | $10,697 | $883,300 | $414,200 | $469,100 |
| 2018 | $10,622 | $871,400 | $414,200 | $457,200 |
| 2017 | $10,238 | $833,700 | $376,300 | $457,400 |
| 2016 | $8,978 | $768,700 | $325,600 | $443,100 |
| 2015 | $9,158 | $754,400 | $325,600 | $428,800 |
| 2014 | $8,737 | $690,100 | $261,200 | $428,900 |
Source: Public Records
Map
Nearby Homes
- 30 Prospect St
- 8 Felsdale Close
- 46 Church St
- 5 Bacon St
- 36 Elmwood Ave Unit 2
- 53 Bacon St
- 19 Glengarry Rd
- 77A Brooks St
- 666 Main St Unit 312
- 666 Main St Unit 315
- 2 Everett Ave
- 13 Nelson St
- 209 Washington St
- 9 Lakeview Terrace
- 446 Highland Ave
- 6 Wyman Ct Unit 6
- 4 Wyman Ct Unit 4
- 32 Oak St
- 1 Copley St
- 39 Town Way
- 409 Main St
- 2 Black Horse Terrace
- 14 Fairview Terrace
- 396 Main St
- 394 Main St
- 4 Black Horse Terrace
- 404 Main St
- 387 Main St
- 1 Black Horse Terrace
- 1 Black Horse Terrace Unit 1
- 1 Black Horse Terrace Unit 2
- 10 Fairview Terrace
- 422 Main St
- 8 Fairview Terrace
- 8 Fairview Terrace
- 3 Fairview Terrace
- 418 Main St Unit 420
- 3 Black Horse Terrace
- 384 Main St
- 379 Main St