Estimated Value: $237,000 - $245,000
3
Beds
2
Baths
1,512
Sq Ft
$159/Sq Ft
Est. Value
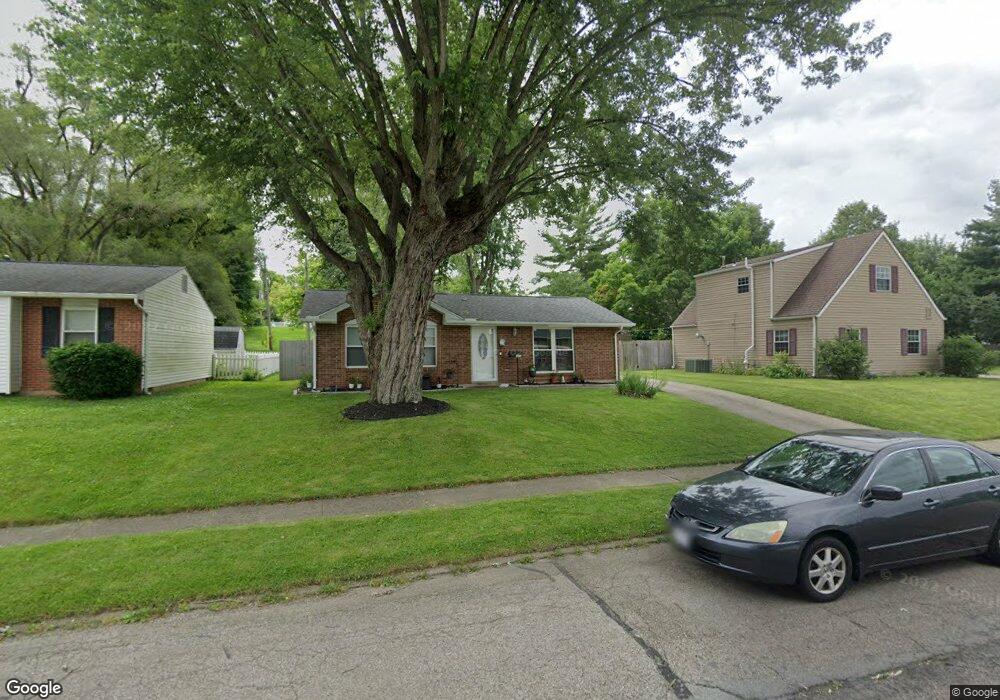
About This Home
This home is located at 403 Marshall Dr, Xenia, OH 45385 and is currently estimated at $239,807, approximately $158 per square foot. 403 Marshall Dr is a home located in Greene County with nearby schools including Xenia High School, Summit Academy Community School for Alternative Learners - Xenia, and Legacy Christian Academy.
Ownership History
Date
Name
Owned For
Owner Type
Purchase Details
Closed on
Jan 24, 2017
Sold by
Oliver Kevin M and Oliver Sarah
Bought by
Hubbard Ryan C and Hubbard Tiffany A
Current Estimated Value
Home Financials for this Owner
Home Financials are based on the most recent Mortgage that was taken out on this home.
Original Mortgage
$72,000
Outstanding Balance
$59,812
Interest Rate
4.32%
Mortgage Type
Purchase Money Mortgage
Estimated Equity
$179,995
Purchase Details
Closed on
Feb 25, 2016
Bought by
Hubbard Ryan C
Purchase Details
Closed on
May 7, 2003
Sold by
Estate Of Donald Hubbard Jr
Bought by
Hubbard Carolyn M
Create a Home Valuation Report for This Property
The Home Valuation Report is an in-depth analysis detailing your home's value as well as a comparison with similar homes in the area
Home Values in the Area
Average Home Value in this Area
Purchase History
| Date | Buyer | Sale Price | Title Company |
|---|---|---|---|
| Hubbard Ryan C | $87,500 | None Available | |
| Hubbard Ryan C | -- | -- | |
| Hubbard Carolyn M | -- | -- |
Source: Public Records
Mortgage History
| Date | Status | Borrower | Loan Amount |
|---|---|---|---|
| Open | Hubbard Ryan C | $72,000 |
Source: Public Records
Tax History Compared to Growth
Tax History
| Year | Tax Paid | Tax Assessment Tax Assessment Total Assessment is a certain percentage of the fair market value that is determined by local assessors to be the total taxable value of land and additions on the property. | Land | Improvement |
|---|---|---|---|---|
| 2024 | $2,403 | $57,630 | $9,350 | $48,280 |
| 2023 | $2,403 | $57,630 | $9,350 | $48,280 |
| 2022 | $2,067 | $42,260 | $5,850 | $36,410 |
| 2021 | $2,095 | $42,260 | $5,850 | $36,410 |
| 2020 | $2,005 | $42,260 | $5,850 | $36,410 |
| 2019 | $1,851 | $36,740 | $6,010 | $30,730 |
| 2018 | $1,859 | $36,740 | $6,010 | $30,730 |
| 2017 | $1,266 | $36,740 | $6,010 | $30,730 |
| 2016 | $1,267 | $33,330 | $6,010 | $27,320 |
| 2015 | $1,270 | $33,330 | $6,010 | $27,320 |
| 2014 | $4,736 | $33,330 | $6,010 | $27,320 |
Source: Public Records
Map
Nearby Homes
- 479 N Stadium Dr
- 508 Marshall Dr
- 568 Louise Dr
- 348 S Stadium Dr
- 513 Redbud Ln
- 610 Saxony Dr
- 656 Eden Roc Dr
- 119 Park Dr
- 659 N King St
- 645 E Church St
- 516 N King St
- 612 E Market St
- 878 N Detroit St
- 137 Pleasant St
- 902 N Detroit St
- 541 E Main St
- 607 E Main St
- 613 N West St
- 1038 Frederick Dr
- 0 N Patton St
- 417 Marshall Dr
- 395 Marshall Dr
- 637 Louise Dr
- 445 Marshall Dr
- 365 Marshall Dr
- 394 Marshall Dr
- 414 Marshall Dr
- 414 Marshall Dr
- 524 N Stadium Dr
- 451 Marshall Dr
- 438 Marshall Dr
- 716 Louise Dr
- 355 Marshall Dr
- 497 Marshall Dr
- 627 Louise Dr
- 448 Marshall Dr
- 510 N Stadium Dr
- 467 Marshall Dr
- 755 Louise Dr
- 352 Marshall Dr