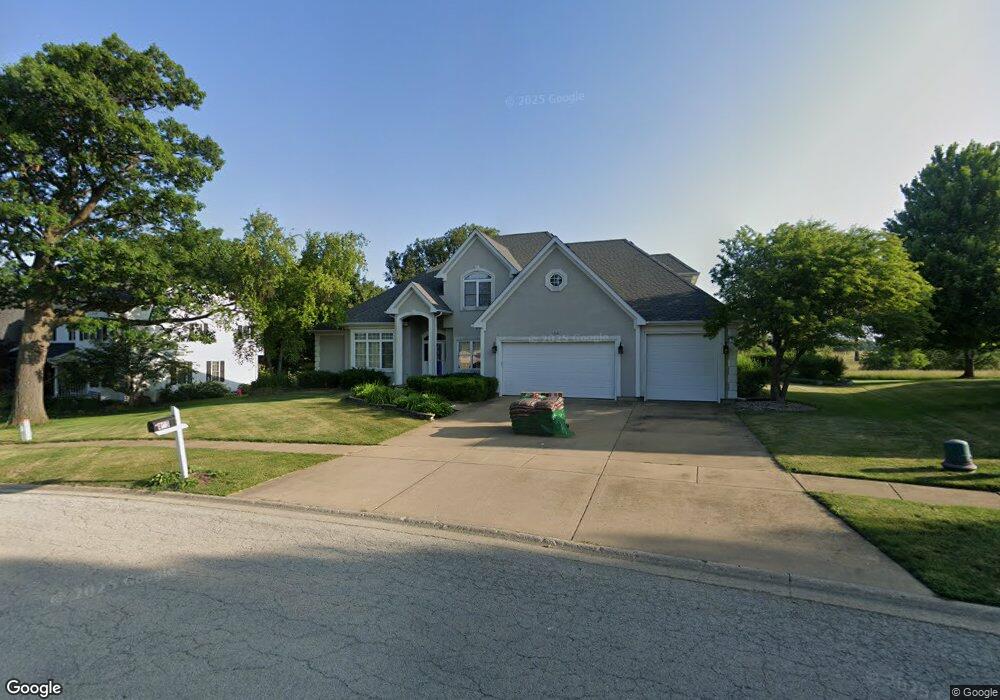
403 Meadow Ln Newark, IL 60541
Estimated Value: $373,000 - $489,000
--
Bed
--
Bath
--
Sq Ft
0.32
Acres
About This Home
This home is located at 403 Meadow Ln, Newark, IL 60541 and is currently estimated at $429,766. 403 Meadow Ln is a home located in Kendall County with nearby schools including Newark Elementary School, Millbrook Junior High School, and Newark Community High School.
Ownership History
Date
Name
Owned For
Owner Type
Purchase Details
Closed on
Jun 10, 2003
Sold by
Harris Trust & Savings Bank
Bought by
Olson Scott H and Olson Janet W
Current Estimated Value
Home Financials for this Owner
Home Financials are based on the most recent Mortgage that was taken out on this home.
Original Mortgage
$100,400
Outstanding Balance
$42,637
Interest Rate
5.36%
Mortgage Type
Credit Line Revolving
Estimated Equity
$387,129
Purchase Details
Closed on
May 3, 2001
Sold by
Olson Scott H and Olson Janet W
Bought by
Harris Trust & Svgs Bank and Trust #Nap-4570
Purchase Details
Closed on
May 15, 1997
Sold by
Toftoy Robert and Robert Toftoy Trust #1
Bought by
Olson Scott H and Olson Janet W
Home Financials for this Owner
Home Financials are based on the most recent Mortgage that was taken out on this home.
Original Mortgage
$29,625
Interest Rate
8.27%
Create a Home Valuation Report for This Property
The Home Valuation Report is an in-depth analysis detailing your home's value as well as a comparison with similar homes in the area
Home Values in the Area
Average Home Value in this Area
Purchase History
| Date | Buyer | Sale Price | Title Company |
|---|---|---|---|
| Olson Scott H | -- | First American Title | |
| Harris Trust & Svgs Bank | -- | -- | |
| Olson Scott H | $39,500 | -- |
Source: Public Records
Mortgage History
| Date | Status | Borrower | Loan Amount |
|---|---|---|---|
| Open | Olson Scott H | $100,400 | |
| Previous Owner | Olson Scott H | $29,625 |
Source: Public Records
Tax History Compared to Growth
Tax History
| Year | Tax Paid | Tax Assessment Tax Assessment Total Assessment is a certain percentage of the fair market value that is determined by local assessors to be the total taxable value of land and additions on the property. | Land | Improvement |
|---|---|---|---|---|
| 2024 | $10,701 | $151,628 | $10,949 | $140,679 |
| 2023 | $8,779 | $138,663 | $10,013 | $128,650 |
| 2022 | $8,779 | $122,310 | $8,832 | $113,478 |
| 2021 | $8,522 | $115,267 | $8,323 | $106,944 |
| 2020 | $9,014 | $110,845 | $8,004 | $102,841 |
| 2019 | $8,966 | $107,952 | $7,795 | $100,157 |
| 2018 | $8,609 | $102,509 | $7,402 | $95,107 |
| 2017 | $8,453 | $99,523 | $7,186 | $92,337 |
| 2016 | $8,395 | $98,333 | $7,100 | $91,233 |
| 2015 | $7,756 | $98,333 | $7,100 | $91,233 |
| 2014 | -- | $96,885 | $7,000 | $89,885 |
| 2013 | -- | $96,199 | $13,100 | $83,099 |
Source: Public Records
Map
Nearby Homes
- 3 Oak Ridge Dr
- 2 N Van Buren St
- 0 E Main St
- 302 E State Route 71
- 502 E Benton St
- 11071 Crimmin Rd
- 208 W Sycamore St
- 122 Belle Rive Dr
- 000 Millington Rd
- 2833 N 4201st Rd
- 4322 E 2859th Rd
- 2989 N 4459th Rd
- 4452 E 2969th Rd
- 4456 E 2969th Rd
- 2853 N 4360th Rd
- 4462 E 2979th Rd
- 15725 Stonewall Dr
- 4455 E 2969th Rd
- 4460 N 4459th Rd
- 2967 N 4459th Rd