Estimated Value: $158,998 - $218,000
--
Bed
--
Bath
1,096
Sq Ft
$174/Sq Ft
Est. Value
About This Home
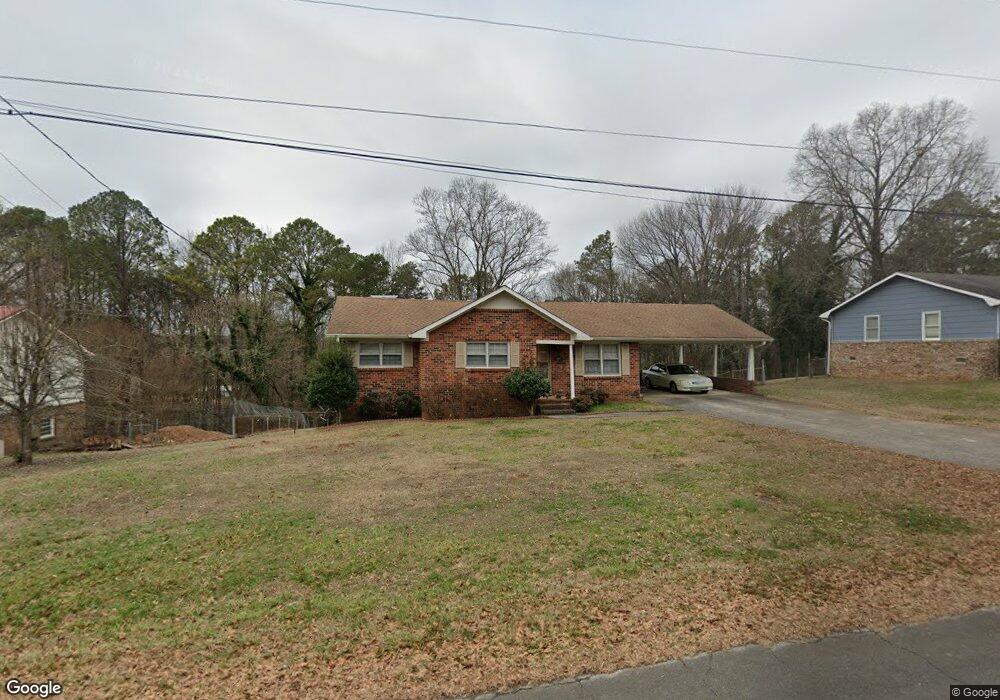
This home is located at 403 Mountain View Rd SE, Rome, GA 30161 and is currently estimated at $191,250, approximately $174 per square foot. 403 Mountain View Rd SE is a home located in Floyd County with nearby schools including Pepperell Middle School, Pepperell High School, and Montessori School of Rome.
Ownership History
Date
Name
Owned For
Owner Type
Purchase Details
Closed on
Mar 17, 2021
Sold by
Curlee Cynthia J
Bought by
Curlee Charles and Mcchargue Terri
Current Estimated Value
Purchase Details
Closed on
Jan 8, 1987
Sold by
Ballard Jo Anne K
Bought by
Curlee Cynthia J
Purchase Details
Closed on
Dec 11, 1979
Sold by
Ballard Jo Anne K
Bought by
Ballard Jo Anne K
Purchase Details
Closed on
Nov 6, 1979
Sold by
Allen Jo Anne K
Bought by
Ballard Jo Anne K
Purchase Details
Closed on
Jan 1, 1979
Sold by
Ballard Robt B and Ballard Joanne K
Bought by
Allen Jo Anne K
Purchase Details
Closed on
Jun 12, 1973
Sold by
Builders Realty & Dev Co
Bought by
Ballard Robt B and Ballard Joanne K
Purchase Details
Closed on
Dec 13, 1972
Sold by
Rod Dempsey Properties Inc
Bought by
Builders Realty & Dev Co
Purchase Details
Closed on
Nov 13, 1972
Sold by
Miller Arthur S and Miller Es
Bought by
Rod Dempsey Properties Inc
Purchase Details
Closed on
Jan 1, 1901
Bought by
Miller Arthur S and Miller Es
Create a Home Valuation Report for This Property
The Home Valuation Report is an in-depth analysis detailing your home's value as well as a comparison with similar homes in the area
Home Values in the Area
Average Home Value in this Area
Purchase History
| Date | Buyer | Sale Price | Title Company |
|---|---|---|---|
| Curlee Charles | -- | -- | |
| Curlee Cynthia J | $35,000 | -- | |
| Ballard Jo Anne K | -- | -- | |
| Ballard Jo Anne K | -- | -- | |
| Allen Jo Anne K | -- | -- | |
| Ballard Robt B | $37,900 | -- | |
| Builders Realty & Dev Co | $2,500 | -- | |
| Rod Dempsey Properties Inc | -- | -- | |
| Miller Arthur S | -- | -- |
Source: Public Records
Tax History Compared to Growth
Tax History
| Year | Tax Paid | Tax Assessment Tax Assessment Total Assessment is a certain percentage of the fair market value that is determined by local assessors to be the total taxable value of land and additions on the property. | Land | Improvement |
|---|---|---|---|---|
| 2024 | $1,872 | $62,061 | $5,600 | $56,461 |
| 2023 | $1,776 | $60,358 | $4,800 | $55,558 |
| 2022 | $1,318 | $44,416 | $4,000 | $40,416 |
| 2021 | $384 | $41,696 | $4,000 | $37,696 |
| 2020 | $359 | $39,820 | $3,200 | $36,620 |
| 2019 | $347 | $38,711 | $3,200 | $35,511 |
| 2018 | $347 | $37,507 | $3,200 | $34,307 |
| 2017 | $347 | $36,973 | $3,200 | $33,773 |
| 2016 | $351 | $36,872 | $3,200 | $33,672 |
| 2015 | $327 | $36,872 | $3,200 | $33,672 |
| 2014 | $327 | $36,872 | $3,200 | $33,672 |
Source: Public Records
Map
Nearby Homes
- 452 Mountain View Rd SE
- 3028 Callier Springs Rd SE
- 3038 Callier Springs Rd SE
- 3018 Callier Springs Rd SE
- 145 Mountain View Rd SE
- 263 Mountain View Rd SE
- 95 Dodd Blvd SE
- 93 Dodd Blvd SE
- 94 Dodd Blvd SE
- 74 Dodd Blvd SE
- 94 A&B Dodd Blvd
- 1 Joe Louis Blvd SE
- 119 Chateau Dr SE
- 113 Chateau Dr SE
- 7 Crestview Ln SE
- 4 Coach Trail SE
- 20 Coventry Dr SE
- 14 Gables Dr SE
- 2107 Rockmart Rd SE
- 46 Turnbull Dr SE
- 393 Mountain View Rd SE
- 413 Mountain View Rd SE
- 423 Mountain View Rd SE
- 383 Mountain View Rd SE
- 402 Mountain View Rd SE
- 0 Mountain View Dr SE Unit 3242433
- 0 Mountain View Dr SE Unit 8071559
- 414 Mountain View Rd SE
- 390 Mountain View Rd SE
- 424 Mountain View Rd SE
- 424 Mountain View Rd SE
- 433 Mountain View Rd SE
- 373 Mountain View Rd SE
- 373 Mountain View Rd SE
- 373 Mountain View Rd SE
- 373 Mountain View Rd SE
- 373 Mountain View Rd SE
- 373 Mountain View Rd SE
- 373 Mountain View Rd SE
- 3 Lakeview St SW