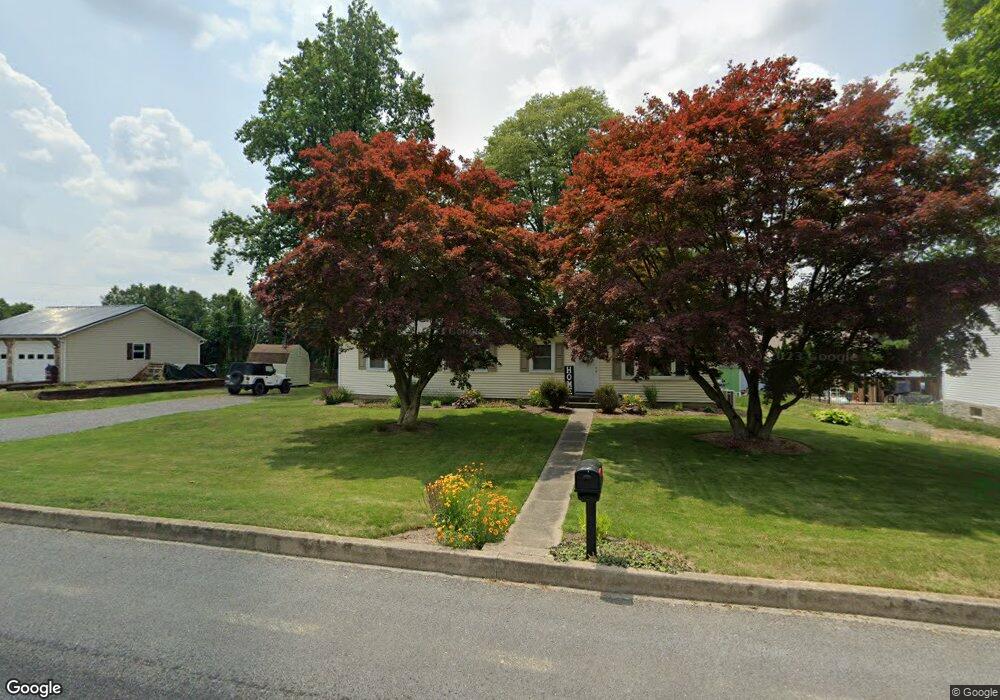
403 N 3rd St Mifflinburg, PA 17844
Estimated Value: $188,374 - $203,000
3
Beds
1
Bath
1,196
Sq Ft
$162/Sq Ft
Est. Value
About This Home
This home is located at 403 N 3rd St, Mifflinburg, PA 17844 and is currently estimated at $194,344, approximately $162 per square foot. 403 N 3rd St is a home located in Union County with nearby schools including Mifflinburg Elementary School, Mifflinburg Area Intermediate School, and Mifflinburg Area Middle School.
Ownership History
Date
Name
Owned For
Owner Type
Purchase Details
Closed on
Nov 26, 2014
Sold by
Yedid Management Group Llc
Bought by
Walter Bryan S and Walter Jaime L
Current Estimated Value
Home Financials for this Owner
Home Financials are based on the most recent Mortgage that was taken out on this home.
Original Mortgage
$105,200
Outstanding Balance
$80,612
Interest Rate
3.93%
Mortgage Type
New Conventional
Estimated Equity
$113,732
Purchase Details
Closed on
May 22, 2014
Sold by
Pietkiewicz Dorothy J and Bush Diana L
Bought by
Yedid Management Group Llc
Create a Home Valuation Report for This Property
The Home Valuation Report is an in-depth analysis detailing your home's value as well as a comparison with similar homes in the area
Home Values in the Area
Average Home Value in this Area
Purchase History
| Date | Buyer | Sale Price | Title Company |
|---|---|---|---|
| Walter Bryan S | $131,500 | Madison Settlement Services | |
| Yedid Management Group Llc | $50,000 | First American Title |
Source: Public Records
Mortgage History
| Date | Status | Borrower | Loan Amount |
|---|---|---|---|
| Open | Walter Bryan S | $105,200 |
Source: Public Records
Tax History Compared to Growth
Tax History
| Year | Tax Paid | Tax Assessment Tax Assessment Total Assessment is a certain percentage of the fair market value that is determined by local assessors to be the total taxable value of land and additions on the property. | Land | Improvement |
|---|---|---|---|---|
| 2025 | $1,509 | $76,200 | $17,700 | $58,500 |
| 2024 | $1,509 | $76,200 | $17,700 | $58,500 |
| 2023 | $1,459 | $76,200 | $17,700 | $58,500 |
| 2022 | $1,452 | $76,200 | $17,700 | $58,500 |
| 2021 | $1,438 | $76,200 | $17,700 | $58,500 |
| 2020 | $1,405 | $76,200 | $17,700 | $58,500 |
| 2019 | $1,377 | $76,200 | $17,700 | $58,500 |
| 2018 | $1,349 | $76,200 | $17,700 | $58,500 |
| 2017 | $1,319 | $76,200 | $17,700 | $58,500 |
| 2016 | $1,251 | $76,200 | $17,700 | $58,500 |
| 2015 | -- | $76,200 | $17,700 | $58,500 |
| 2014 | -- | $76,200 | $17,700 | $58,500 |
Source: Public Records
Map
Nearby Homes