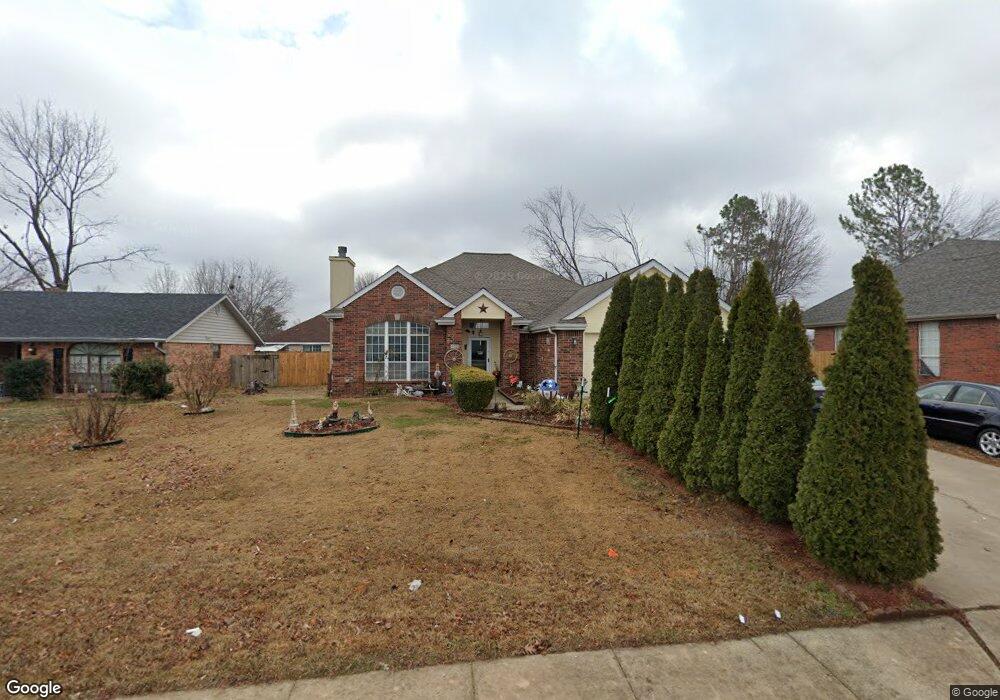
403 N 40th St Rogers, AR 72756
Estimated Value: $337,953 - $383,000
3
Beds
2
Baths
1,757
Sq Ft
$209/Sq Ft
Est. Value
About This Home
This home is located at 403 N 40th St, Rogers, AR 72756 and is currently estimated at $366,738, approximately $208 per square foot. 403 N 40th St is a home located in Benton County with nearby schools including Reagan Elementary School, Oakdale Middle School, and Rogers Heritage High School.
Ownership History
Date
Name
Owned For
Owner Type
Purchase Details
Closed on
Apr 20, 2020
Sold by
Aguila Miguel Angel and Aguila Guadalupe
Bought by
Aguila Miguel Angel and Aguila Guadalupe
Current Estimated Value
Purchase Details
Closed on
Dec 22, 2005
Sold by
Burch Adam Ryan and Burch Sara B
Bought by
Aguila Migual A
Home Financials for this Owner
Home Financials are based on the most recent Mortgage that was taken out on this home.
Original Mortgage
$158,000
Outstanding Balance
$87,573
Interest Rate
6.23%
Mortgage Type
New Conventional
Estimated Equity
$279,165
Purchase Details
Closed on
Feb 26, 2002
Bought by
Burch
Purchase Details
Closed on
Jul 30, 1998
Bought by
Wrona
Purchase Details
Closed on
Dec 2, 1994
Bought by
Mouhalis
Purchase Details
Closed on
Apr 1, 1994
Bought by
Bradshaw
Purchase Details
Closed on
Feb 3, 1993
Bought by
Stem
Purchase Details
Closed on
Apr 2, 1992
Bought by
Roberts and Roberts Stem
Create a Home Valuation Report for This Property
The Home Valuation Report is an in-depth analysis detailing your home's value as well as a comparison with similar homes in the area
Home Values in the Area
Average Home Value in this Area
Purchase History
| Date | Buyer | Sale Price | Title Company |
|---|---|---|---|
| Aguila Miguel Angel | -- | None Available | |
| Aguila Migual A | $158,000 | None Available | |
| Burch | $118,000 | -- | |
| Wrona | $103,000 | -- | |
| Mouhalis | $99,000 | -- | |
| Bradshaw | $95,000 | -- | |
| Stem | -- | -- | |
| Roberts | $14,000 | -- |
Source: Public Records
Mortgage History
| Date | Status | Borrower | Loan Amount |
|---|---|---|---|
| Open | Aguila Migual A | $158,000 |
Source: Public Records
Tax History Compared to Growth
Tax History
| Year | Tax Paid | Tax Assessment Tax Assessment Total Assessment is a certain percentage of the fair market value that is determined by local assessors to be the total taxable value of land and additions on the property. | Land | Improvement |
|---|---|---|---|---|
| 2025 | $2,266 | $57,707 | $19,000 | $38,707 |
| 2024 | $2,027 | $57,707 | $19,000 | $38,707 |
| 2023 | $1,843 | $37,280 | $9,000 | $28,280 |
| 2022 | $1,769 | $37,280 | $9,000 | $28,280 |
| 2021 | $1,617 | $37,280 | $9,000 | $28,280 |
| 2020 | $1,096 | $26,800 | $4,600 | $22,200 |
| 2019 | $1,096 | $26,800 | $4,600 | $22,200 |
| 2018 | $1,121 | $26,800 | $4,600 | $22,200 |
| 2017 | $981 | $26,800 | $4,600 | $22,200 |
| 2016 | $981 | $26,800 | $4,600 | $22,200 |
| 2015 | $1,292 | $24,430 | $4,200 | $20,230 |
| 2014 | $942 | $24,430 | $4,200 | $20,230 |
Source: Public Records
Map
Nearby Homes
- 3807 W Cedar St
- 401 N 38th Place
- 3801 W Cedar St
- 3807 W Locust St
- 3907 Lupine Way
- 11 units total W Beechwood Dr
- 3604 W Beechwood Dr
- 505 N 37th St
- 600 N 37th St
- 4126 (MODEL UNIT) W Olive St
- 3506 W Olive St
- 3407 W Mockingbird Ln
- 9348 Arkansas 12
- 1105 N Cardinal Dr
- 835 S 40th St
- 2913 Richwood Cir
- 3505 W Center St
- Lots 44-47 N Cardinal Dr
- 2821 W Persimmon St
- 2816 Valley West Ct
- 405 N 40th St
- 401 N 40th St
- 303 N 40th St
- 404 N 39th Place
- 402 N 39th Place
- 406 N 39th Place
- 408 N 39th Place
- 400 N 39th Place
- 409 N 40th St
- 410 N 39th Place
- 401 N 39th Place
- 311 S 40th St
- 405 N 39th Place
- 3912 W Cedar St
- 303 S 40th Str St
- 412 N 39th Place
- 407 N 39th Place
- 409 N 39th Place
- 409 N 39th Place
- 402 N 39th St