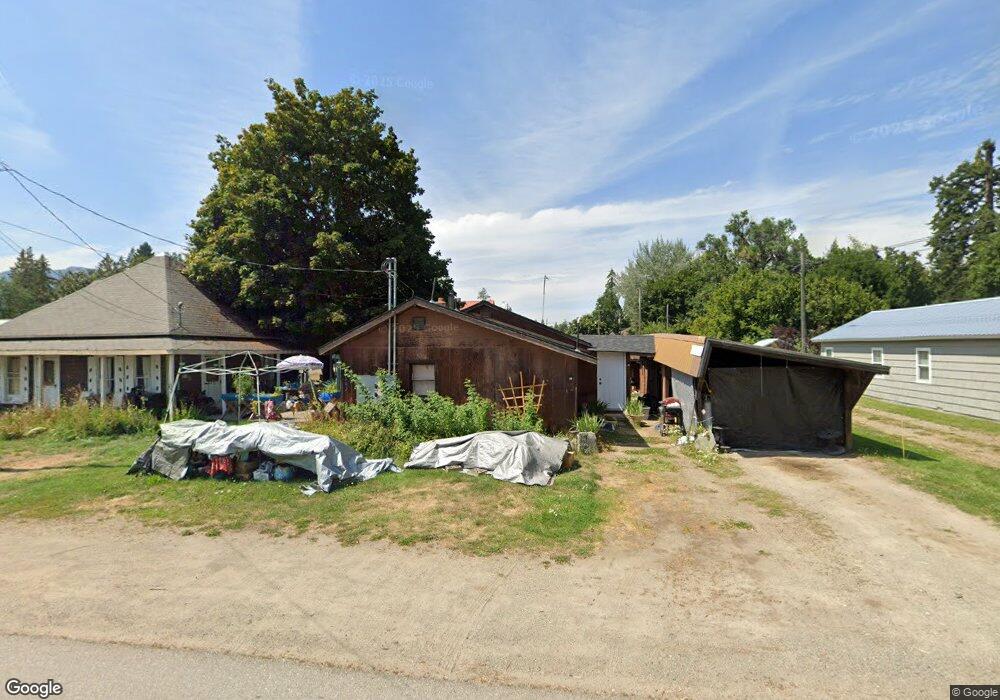
403 N Cedar St Clark Fork, ID 83811
Estimated Value: $248,000 - $312,000
1
Bed
2
Baths
1,484
Sq Ft
$182/Sq Ft
Est. Value
About This Home
This home is located at 403 N Cedar St, Clark Fork, ID 83811 and is currently estimated at $270,417, approximately $182 per square foot. 403 N Cedar St is a home located in Bonner County with nearby schools including Hope Elementary School and Clark Fork Junior/Senior High School.
Ownership History
Date
Name
Owned For
Owner Type
Purchase Details
Closed on
Aug 19, 2021
Sold by
May Syth Marlene and Darus Cecil
Bought by
7B Investments Llc
Current Estimated Value
Home Financials for this Owner
Home Financials are based on the most recent Mortgage that was taken out on this home.
Original Mortgage
$175,000
Interest Rate
2.9%
Mortgage Type
Construction
Purchase Details
Closed on
Jun 1, 2018
Sold by
Syth Cecil D
Bought by
Syth Cecil and Syth Marlene M
Create a Home Valuation Report for This Property
The Home Valuation Report is an in-depth analysis detailing your home's value as well as a comparison with similar homes in the area
Home Values in the Area
Average Home Value in this Area
Purchase History
| Date | Buyer | Sale Price | Title Company |
|---|---|---|---|
| 7B Investments Llc | -- | Title One Title | |
| Syth Cecil | -- | None Available |
Source: Public Records
Mortgage History
| Date | Status | Borrower | Loan Amount |
|---|---|---|---|
| Closed | 7B Investments Llc | $175,000 |
Source: Public Records
Tax History
| Year | Tax Paid | Tax Assessment Tax Assessment Total Assessment is a certain percentage of the fair market value that is determined by local assessors to be the total taxable value of land and additions on the property. | Land | Improvement |
|---|---|---|---|---|
| 2025 | $1,362 | $199,589 | $122,749 | $76,840 |
| 2024 | $1,468 | $219,909 | $142,249 | $77,660 |
| 2023 | $1,435 | $212,451 | $142,249 | $70,202 |
| 2022 | $1,223 | $152,607 | $72,832 | $79,775 |
| 2021 | $1,374 | $178,682 | $56,760 | $121,922 |
| 2020 | $1,313 | $152,903 | $47,416 | $105,487 |
| 2019 | $1,141 | $162,122 | $47,416 | $114,706 |
| 2018 | $1,080 | $142,432 | $47,595 | $94,837 |
| 2017 | $1,080 | $130,418 | $0 | $0 |
| 2016 | $882 | $99,509 | $0 | $0 |
| 2015 | -- | $85,418 | $0 | $0 |
| 2014 | -- | $64,917 | $0 | $0 |
Source: Public Records
Map
Nearby Homes
- 60317 Idaho 200
- NNA Hwy 200
- nna Lightning Creek Rd
- 104 N Mill St
- 210 E 5th
- 102 E 2nd Ave
- 318 E 3rd Ave
- 16 Elk Horn
- NKA Silver Creek Rd
- 940 Sled Run Trail
- 582 Mountain View Rd
- 76 Shadow Valley Ln
- 123 E Mountain View Rd
- 58250 Idaho 200
- Tract 3 Usfs 2294
- Tract 4 Usfs 2294
- Tract 5 Usfs 2294
- Tract 6 Usfs 2294
- Usfs Rd 2294
- Tract 7 Usfs 2294
Your Personal Tour Guide
Ask me questions while you tour the home.