J
Seller's Agent in 2022
Jon Million
Carpenter, REALTORS®

Estimated Value: $127,000 - $133,000
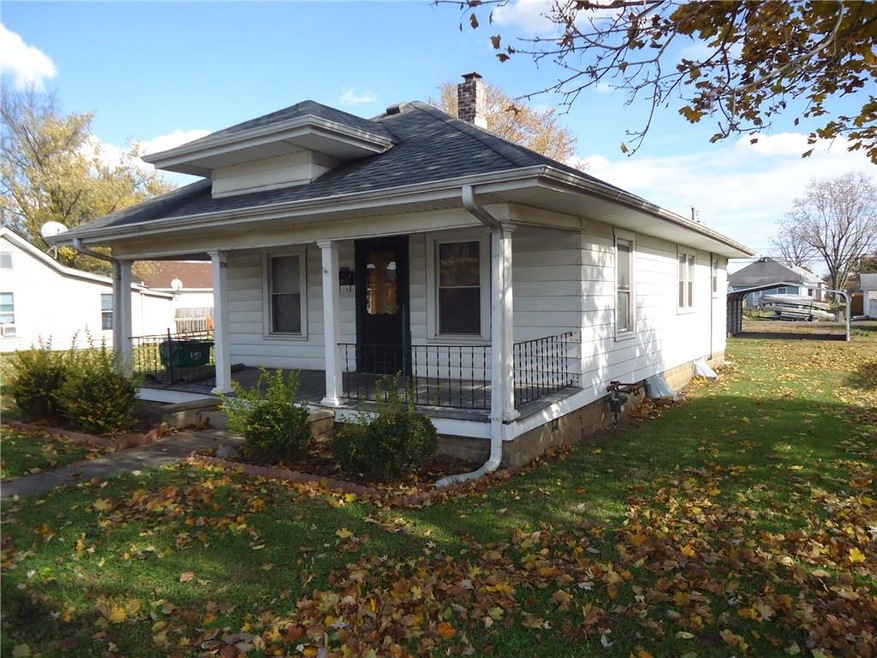
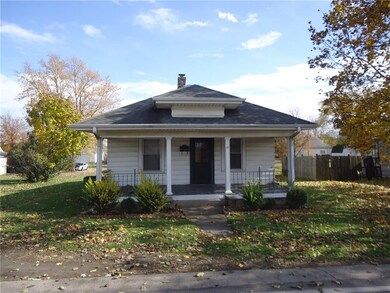
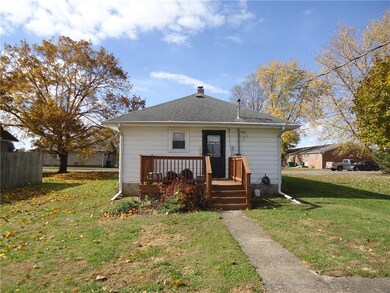
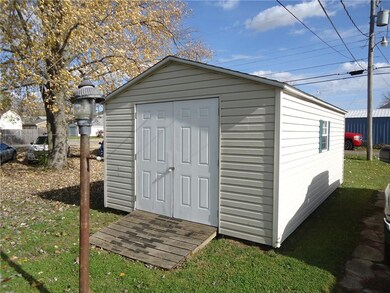
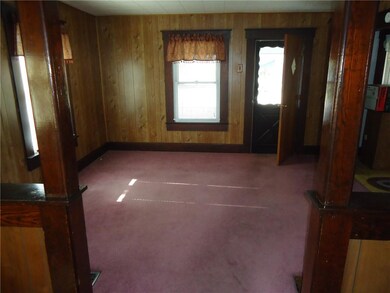
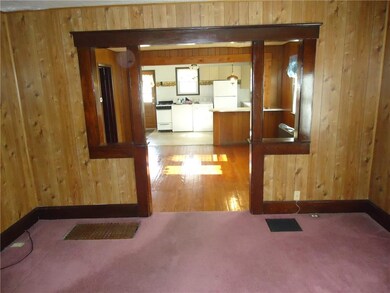
This classic 2 bedroom , 1 bath bungalow home will not disappoint you. Move-in ready with appliances included. Located near historic downtown Edinburgh with quick access to interstate 65. A/C New in 2019, electric-upgraded 2011, carport and mini barn.
Last Agent to Sell the Property
Jon Million
Carpenter, REALTORS® Listed on: 11/12/2021
Last Buyer's Agent
Carrie Vavul
Carpenter, REALTORS®
| Date | Buyer | Sale Price | Title Company |
|---|---|---|---|
| State Of Indiana | $3,630 | None Listed On Document | |
| Karkasy Ian | $103,500 | Ata National Title |
| Date | Status | Borrower | Loan Amount |
|---|---|---|---|
| Previous Owner | Karkasy Ian | $101,624 |
| Date | Event | Price | List to Sale | Price per Sq Ft |
|---|---|---|---|---|
| 02/14/2022 02/14/22 | Sold | $103,500 | -13.8% | $67 / Sq Ft |
| 01/13/2022 01/13/22 | Pending | -- | -- | -- |
| 11/12/2021 11/12/21 | For Sale | $120,000 | -- | $78 / Sq Ft |
| Year | Tax Paid | Tax Assessment Tax Assessment Total Assessment is a certain percentage of the fair market value that is determined by local assessors to be the total taxable value of land and additions on the property. | Land | Improvement |
|---|---|---|---|---|
| 2025 | $1,040 | $99,800 | $16,700 | $83,100 |
| 2024 | $1,040 | $93,600 | $17,000 | $76,600 |
| 2023 | $1,028 | $87,900 | $17,000 | $70,900 |
| 2022 | $837 | $75,900 | $17,000 | $58,900 |
| 2021 | $1,374 | $68,700 | $13,800 | $54,900 |
| 2020 | $1,278 | $63,900 | $12,500 | $51,400 |
| 2019 | $1,278 | $63,900 | $12,500 | $51,400 |
| 2018 | $1,133 | $57,800 | $12,500 | $45,300 |
| 2017 | $1,110 | $55,500 | $12,500 | $43,000 |
| 2016 | $1,004 | $49,400 | $11,300 | $38,100 |
| 2014 | $934 | $51,200 | $11,300 | $39,900 |
| 2013 | $934 | $46,700 | $12,400 | $34,300 |
J
Seller's Agent in 2022
Jon Million
Carpenter, REALTORS®
C
Buyer's Agent in 2022
Carrie Vavul
Carpenter, REALTORS®
Source: MIBOR Broker Listing Cooperative®
MLS Number: 21824648
APN: 41-12-34-012-020.000-002
Disclaimer: Certain information contained herein is derived from information provided by parties other than Homes.com. All information provided is deemed reliable, but is not guaranteed to be accurate and should be independently verified.
![]() Based on information submitted to the MLS GRID. All data is obtained from various sources and may not have been verified by broker or MLS GRID. Supplied Open House Information is subject to change without notice. All information should be independently reviewed and verified for accuracy. Properties may or may not be listed by the office/agent presenting the information. Some IDX listings have been excluded from this website.
Based on information submitted to the MLS GRID. All data is obtained from various sources and may not have been verified by broker or MLS GRID. Supplied Open House Information is subject to change without notice. All information should be independently reviewed and verified for accuracy. Properties may or may not be listed by the office/agent presenting the information. Some IDX listings have been excluded from this website.
