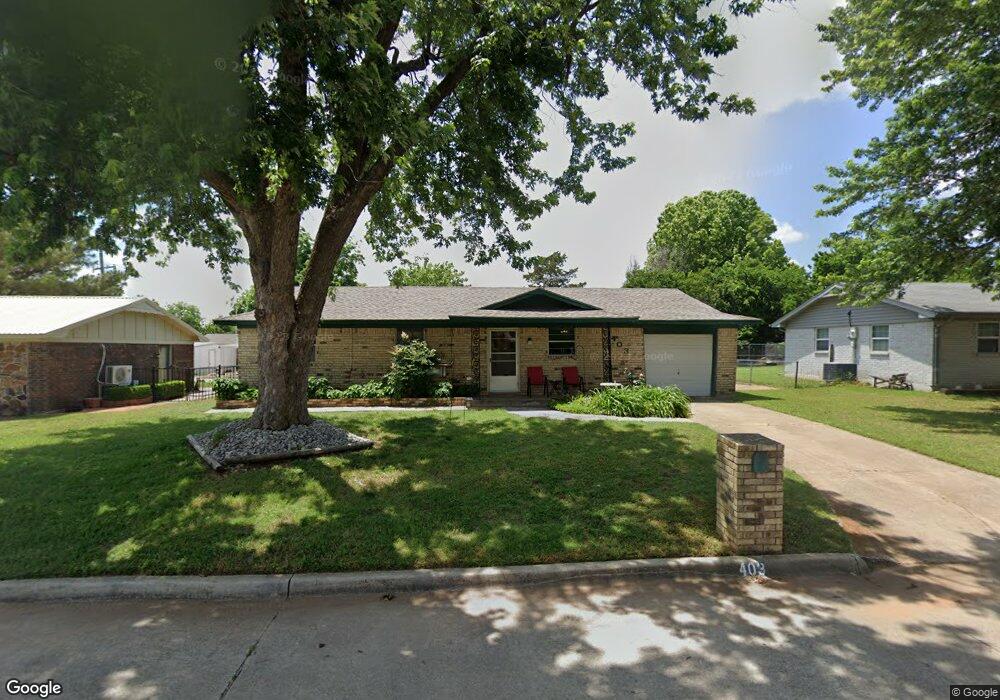
403 N J St Duncan, OK 73533
Estimated Value: $76,000 - $106,000
3
Beds
2
Baths
1,188
Sq Ft
$77/Sq Ft
Est. Value
About This Home
This home is located at 403 N J St, Duncan, OK 73533 and is currently estimated at $91,363, approximately $76 per square foot. 403 N J St is a home located in Stephens County with nearby schools including Woodrow Wilson Elementary School, Duncan Middle School, and Duncan High School.
Ownership History
Date
Name
Owned For
Owner Type
Purchase Details
Closed on
Aug 1, 2018
Sold by
Shults Linda J
Bought by
Shults Linda and Shults Robert
Current Estimated Value
Purchase Details
Closed on
Jan 9, 2017
Sold by
Williams Myra Evelyn
Bought by
Shults Linda J
Home Financials for this Owner
Home Financials are based on the most recent Mortgage that was taken out on this home.
Original Mortgage
$42,000
Interest Rate
4.03%
Mortgage Type
New Conventional
Purchase Details
Closed on
Aug 8, 2003
Sold by
Williams Jack N
Bought by
Williams Myra Evelyn
Purchase Details
Closed on
Jul 14, 2003
Sold by
Weems Christine Marie
Purchase Details
Closed on
Nov 19, 1997
Sold by
Weems John W
Purchase Details
Closed on
Sep 23, 1994
Sold by
Mcdonald Olen Michael
Purchase Details
Closed on
Sep 25, 1991
Sold by
Mcdonald Cheryl Ann
Create a Home Valuation Report for This Property
The Home Valuation Report is an in-depth analysis detailing your home's value as well as a comparison with similar homes in the area
Purchase History
| Date | Buyer | Sale Price | Title Company |
|---|---|---|---|
| Shults Linda | -- | None Available | |
| Shults Linda J | $52,500 | None Available | |
| Williams Myra Evelyn | $30,000 | -- | |
| Williams Myra Evelyn | $30,000 | None Available | |
| -- | $42,000 | -- | |
| -- | -- | -- | |
| -- | $25,000 | -- | |
| -- | -- | -- |
Source: Public Records
Mortgage History
| Date | Status | Borrower | Loan Amount |
|---|---|---|---|
| Previous Owner | Shults Linda J | $42,000 |
Source: Public Records
Tax History
| Year | Tax Paid | Tax Assessment Tax Assessment Total Assessment is a certain percentage of the fair market value that is determined by local assessors to be the total taxable value of land and additions on the property. | Land | Improvement |
|---|---|---|---|---|
| 2025 | $487 | $6,781 | $504 | $6,277 |
| 2024 | $459 | $6,391 | $504 | $5,887 |
| 2023 | $459 | $6,205 | $504 | $5,701 |
| 2022 | $431 | $6,256 | $504 | $5,752 |
| 2021 | $417 | $5,897 | $504 | $5,393 |
| 2020 | $417 | $5,827 | $504 | $5,323 |
| 2019 | $408 | $5,715 | $504 | $5,211 |
| 2018 | $430 | $5,826 | $504 | $5,322 |
| 2017 | $543 | $6,321 | $504 | $5,817 |
| 2016 | $635 | $7,466 | $497 | $6,969 |
| 2015 | $220 | $7,111 | $468 | $6,643 |
| 2014 | $220 | $6,772 | $440 | $6,332 |
Source: Public Records
Map
Nearby Homes
Your Personal Tour Guide
Ask me questions while you tour the home.