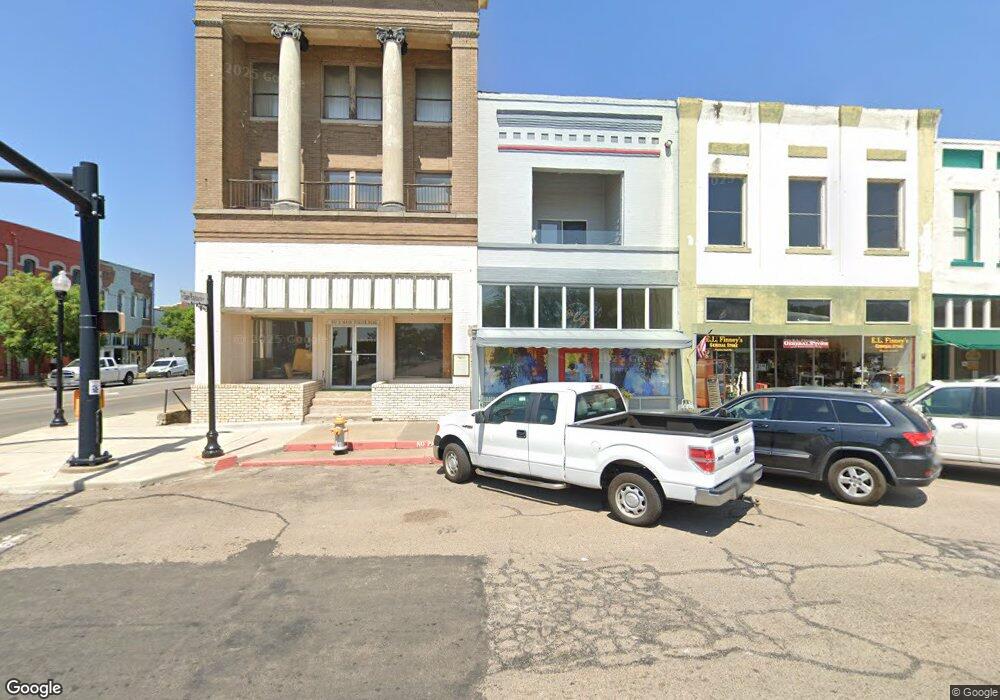
403 N Main St Bonham, TX 75418
Estimated Value: $299,221
--
Bed
2
Baths
2,288
Sq Ft
$131/Sq Ft
Est. Value
About This Home
This home is located at 403 N Main St, Bonham, TX 75418 and is currently priced at $299,221, approximately $130 per square foot. 403 N Main St is a home with nearby schools including Finley-Oates Elementary School, LH Rather Jr High School, and Morning Star Academy.
Ownership History
Date
Name
Owned For
Owner Type
Purchase Details
Closed on
Apr 6, 2021
Sold by
Burnham Bruce Edward and Burnham Gwendolyn Gail
Bought by
Rose Colored Investments Llc
Current Estimated Value
Home Financials for this Owner
Home Financials are based on the most recent Mortgage that was taken out on this home.
Original Mortgage
$240,000
Outstanding Balance
$215,388
Interest Rate
2.9%
Mortgage Type
Commercial
Purchase Details
Closed on
Aug 28, 2015
Sold by
Cox Patricia Ann
Bought by
Burnham Bruce E and Burnham Gwendolyn G
Home Financials for this Owner
Home Financials are based on the most recent Mortgage that was taken out on this home.
Original Mortgage
$40,000
Interest Rate
4.12%
Mortgage Type
Purchase Money Mortgage
Purchase Details
Closed on
Aug 6, 2013
Sold by
Bowen James Robert and Bowen Virginia
Bought by
Burnham Bruce Edward and Burnham Gwendolyn Gail
Home Financials for this Owner
Home Financials are based on the most recent Mortgage that was taken out on this home.
Original Mortgage
$48,750
Interest Rate
6.5%
Mortgage Type
Commercial
Create a Home Valuation Report for This Property
The Home Valuation Report is an in-depth analysis detailing your home's value as well as a comparison with similar homes in the area
Home Values in the Area
Average Home Value in this Area
Purchase History
| Date | Buyer | Sale Price | Title Company |
|---|---|---|---|
| Rose Colored Investments Llc | -- | Cole Title Co | |
| Burnham Bruce E | -- | Cole Title Company | |
| Burnham Bruce Edward | -- | Colt Title Co |
Source: Public Records
Mortgage History
| Date | Status | Borrower | Loan Amount |
|---|---|---|---|
| Open | Rose Colored Investments Llc | $240,000 | |
| Previous Owner | Burnham Bruce E | $40,000 | |
| Previous Owner | Burnham Bruce Edward | $48,750 |
Source: Public Records
Tax History Compared to Growth
Tax History
| Year | Tax Paid | Tax Assessment Tax Assessment Total Assessment is a certain percentage of the fair market value that is determined by local assessors to be the total taxable value of land and additions on the property. | Land | Improvement |
|---|---|---|---|---|
| 2025 | $5,721 | $412,770 | $37,370 | $375,400 |
| 2024 | $5,721 | $337,930 | $19,810 | $318,120 |
| 2023 | $4,847 | $245,790 | $15,760 | $230,030 |
| 2022 | $4,992 | $227,000 | $15,760 | $211,240 |
| 2021 | $4,562 | $180,510 | $9,880 | $170,630 |
| 2020 | $4,268 | $166,970 | $8,870 | $158,100 |
| 2019 | $4,436 | $166,940 | $8,870 | $158,070 |
| 2018 | $4,372 | $164,720 | $8,870 | $155,850 |
| 2017 | $3,694 | $145,210 | $8,880 | $136,330 |
| 2016 | $3,469 | $135,710 | $8,520 | $127,190 |
| 2015 | -- | $126,410 | $8,430 | $117,980 |
| 2014 | -- | $58,950 | $8,880 | $50,070 |
Source: Public Records
Map
Nearby Homes
- LOT 2 TBD County Road 2005
- TBD Fm 3221
- TBD LOT 1 County Road 2005
- tbd lot 3 County Road 2005
- 1 E 1st & Pine St
- 505 W 3rd St
- 317 W Sam Rayburn Dr
- 203 Star St
- 220 W 6th St
- 320 W 6th St
- 415 W 7th St
- 602 W 3rd St
- 423 E 5th St
- 417 W 8th St
- 505 S Main St
- 514 E 5th St
- 503 Braz St
- 713 W Sam Rayburn Dr
- 400 E 7th St
- 202 Pine St
- 405 N Main St
- 413 N Main St
- 111 Hwy 82
- 109 W Sam Rayburn Dr
- 111 W Sam Rayburn Dr
- 321 N Main St
- 113 W Sam Rayburn Dr
- 117 W Sam Rayburn Dr
- TBD Fm 2815 Rd
- 913 Cr 4232 Rd
- 108 E Sam Rayburn Dr
- 314 N Main St
- Lot 13 Largo - Lot 13 St
- tbd County Rd 1110
- TBD County Rd 2605
- TBD S Fm 271
- Lot 36 W Hemby Way
- TBD Cr 4245b
- Lot 37 Hemby Way
- Lot 36 Hemby Way