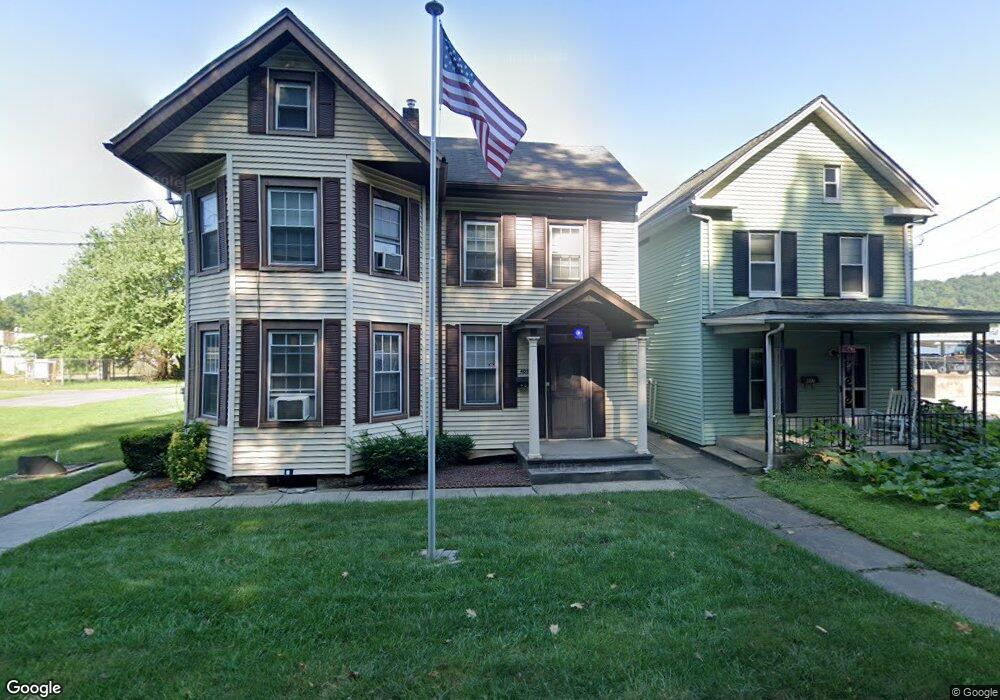
403 N Main St Phillipsburg, NJ 08865
Estimated Value: $175,783 - $276,000
--
Bed
--
Bath
1,620
Sq Ft
$143/Sq Ft
Est. Value
About This Home
This home is located at 403 N Main St, Phillipsburg, NJ 08865 and is currently estimated at $232,446, approximately $143 per square foot. 403 N Main St is a home located in Warren County with nearby schools including Phillipsburg High School, Easton Arts Academy Elementary Cs, and Sts. Philip & James School.
Ownership History
Date
Name
Owned For
Owner Type
Purchase Details
Closed on
Nov 22, 1999
Sold by
Snyder Richard T and Snyder Robin G
Bought by
Perkins Glenn
Current Estimated Value
Home Financials for this Owner
Home Financials are based on the most recent Mortgage that was taken out on this home.
Original Mortgage
$89,540
Outstanding Balance
$27,377
Interest Rate
7.77%
Mortgage Type
FHA
Estimated Equity
$205,069
Create a Home Valuation Report for This Property
The Home Valuation Report is an in-depth analysis detailing your home's value as well as a comparison with similar homes in the area
Home Values in the Area
Average Home Value in this Area
Purchase History
| Date | Buyer | Sale Price | Title Company |
|---|---|---|---|
| Perkins Glenn | $88,000 | -- |
Source: Public Records
Mortgage History
| Date | Status | Borrower | Loan Amount |
|---|---|---|---|
| Open | Perkins Glenn | $89,540 |
Source: Public Records
Tax History Compared to Growth
Tax History
| Year | Tax Paid | Tax Assessment Tax Assessment Total Assessment is a certain percentage of the fair market value that is determined by local assessors to be the total taxable value of land and additions on the property. | Land | Improvement |
|---|---|---|---|---|
| 2025 | $3,513 | $77,300 | $16,100 | $61,200 |
| 2024 | $3,244 | $77,300 | $16,100 | $61,200 |
| 2023 | $3,206 | $77,300 | $16,100 | $61,200 |
| 2022 | $3,206 | $77,300 | $16,100 | $61,200 |
| 2021 | $3,104 | $77,300 | $16,100 | $61,200 |
| 2020 | $3,124 | $77,300 | $16,100 | $61,200 |
| 2019 | $3,077 | $77,300 | $16,100 | $61,200 |
| 2018 | $3,077 | $77,300 | $16,100 | $61,200 |
| 2017 | $3,063 | $77,300 | $16,100 | $61,200 |
| 2016 | $3,016 | $77,300 | $16,100 | $61,200 |
| 2015 | $2,993 | $75,900 | $16,100 | $59,800 |
| 2014 | $2,843 | $75,900 | $16,100 | $59,800 |
Source: Public Records
Map
Nearby Homes