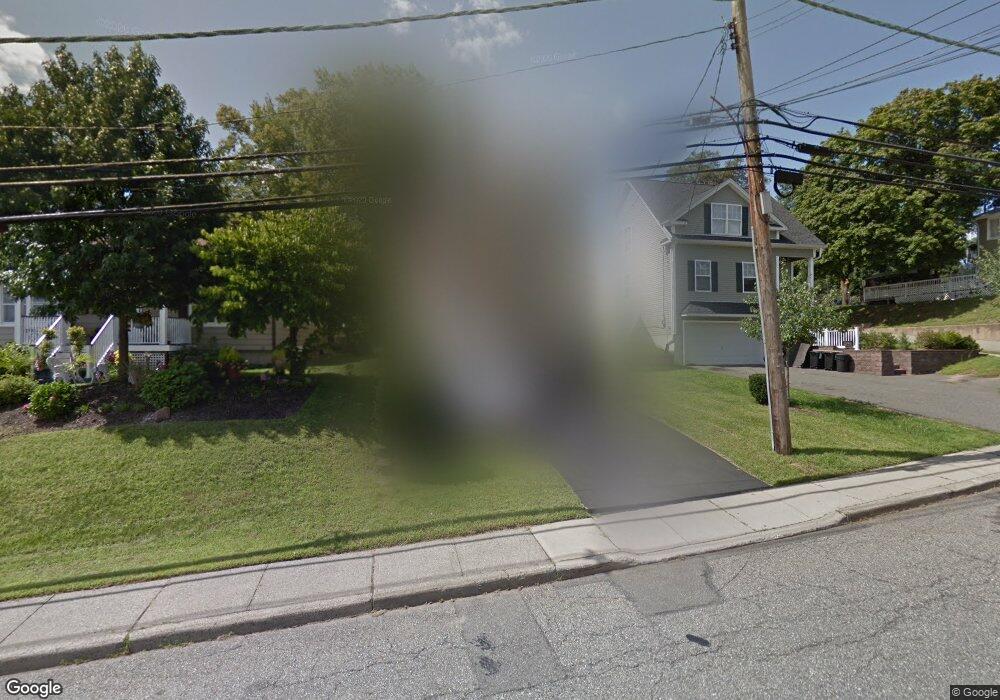
403 N Main St Wharton, NJ 07885
Estimated Value: $486,000 - $647,072
4
Beds
4
Baths
2,680
Sq Ft
$218/Sq Ft
Est. Value
About This Home
This home is located at 403 N Main St, Wharton, NJ 07885 and is currently estimated at $583,768, approximately $217 per square foot. 403 N Main St is a home located in Morris County with nearby schools including Marie V. Duffy Elementary School and A C Mac Kinnon Middle School.
Ownership History
Date
Name
Owned For
Owner Type
Purchase Details
Closed on
Apr 20, 2009
Sold by
Lewthwaite Edward S
Bought by
Gilliland Francis S
Current Estimated Value
Home Financials for this Owner
Home Financials are based on the most recent Mortgage that was taken out on this home.
Original Mortgage
$344,000
Outstanding Balance
$215,587
Interest Rate
4.86%
Mortgage Type
VA
Estimated Equity
$368,181
Purchase Details
Closed on
May 18, 2007
Sold by
Lewthwaite Edward S
Bought by
Lewthwaite Edward S
Purchase Details
Closed on
Jun 15, 2006
Sold by
Borough Of Wharton
Bought by
Lewthwaite Edward
Create a Home Valuation Report for This Property
The Home Valuation Report is an in-depth analysis detailing your home's value as well as a comparison with similar homes in the area
Home Values in the Area
Average Home Value in this Area
Purchase History
| Date | Buyer | Sale Price | Title Company |
|---|---|---|---|
| Gilliland Francis S | $344,000 | Multiple | |
| Lewthwaite Edward S | -- | None Available | |
| Lewthwaite Edward | $105,000 | -- |
Source: Public Records
Mortgage History
| Date | Status | Borrower | Loan Amount |
|---|---|---|---|
| Open | Gilliland Francis S | $344,000 |
Source: Public Records
Tax History
| Year | Tax Paid | Tax Assessment Tax Assessment Total Assessment is a certain percentage of the fair market value that is determined by local assessors to be the total taxable value of land and additions on the property. | Land | Improvement |
|---|---|---|---|---|
| 2025 | $13,410 | $486,800 | $101,000 | $385,800 |
| 2024 | $12,611 | $453,200 | $96,500 | $356,700 |
| 2023 | $12,611 | $421,200 | $92,000 | $329,200 |
| 2022 | $11,569 | $397,300 | $92,000 | $305,300 |
| 2021 | $11,569 | $379,200 | $92,000 | $287,200 |
| 2020 | $11,261 | $362,200 | $87,500 | $274,700 |
| 2019 | $10,646 | $345,200 | $83,000 | $262,200 |
| 2018 | $10,109 | $334,500 | $83,000 | $251,500 |
| 2017 | $9,251 | $302,800 | $78,500 | $224,300 |
| 2016 | $8,011 | $281,400 | $78,500 | $202,900 |
| 2015 | $8,440 | $279,100 | $78,500 | $200,600 |
| 2014 | $8,945 | $292,600 | $78,500 | $214,100 |
Source: Public Records
Map
Nearby Homes
- 431 N Main St
- 33 Meadow Ave
- 748 Upperway
- 849 Upperway Unit 849E
- 322 Richard Mine Rd Unit 3
- 322 Richard Mine Rd
- 322 Richard Mine Rd Unit 6
- 322 Richard Mine Rd Unit 5
- 322 M5richard Mine Rd Unit 5
- 322 B9 Richard Mine Rd Unit 9
- 5 N Main St
- 104 E Central Ave
- 41 Kelly Ln
- 14 Kelly Ln
- 62 Union St
- 7 Moreno Place
- 81 Jefferson Ave
- 4 Sickle St
- 75 White St
- 83 White St
Your Personal Tour Guide
Ask me questions while you tour the home.