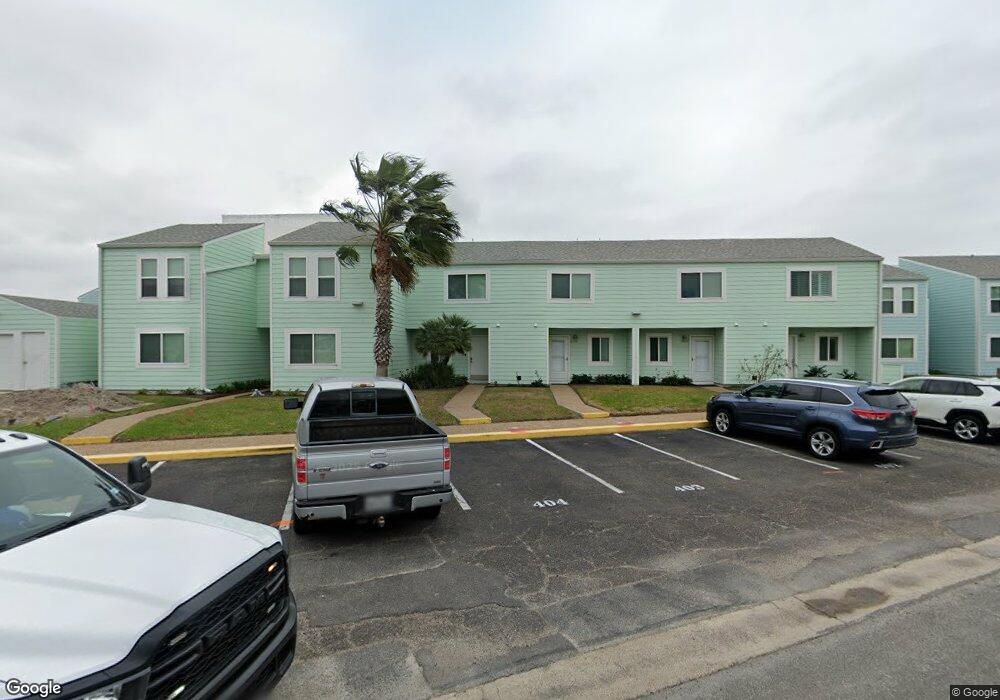
403 Nassau Dr Unit 403 NASSAU DRIVE Rockport, TX 78382
Estimated Value: $370,755 - $400,000
2
Beds
3
Baths
1,122
Sq Ft
$344/Sq Ft
Est. Value
About This Home
This home is located at 403 Nassau Dr Unit 403 NASSAU DRIVE, Rockport, TX 78382 and is currently estimated at $386,439, approximately $344 per square foot. 403 Nassau Dr Unit 403 NASSAU DRIVE is a home located in Aransas County with nearby schools including Rockport-Fulton Middle School and Rockport-Fulton High School.
Ownership History
Date
Name
Owned For
Owner Type
Purchase Details
Closed on
Jun 17, 2015
Sold by
Smith Stanley T and Smith Elizabeth Ann
Bought by
Rockport Condo Llc
Current Estimated Value
Purchase Details
Closed on
Jun 13, 2008
Sold by
Click Sheila D
Bought by
Roy Berton G and Gauche Roy Betty
Home Financials for this Owner
Home Financials are based on the most recent Mortgage that was taken out on this home.
Original Mortgage
$200,000
Interest Rate
6.07%
Mortgage Type
New Conventional
Purchase Details
Closed on
May 14, 2007
Sold by
Lenzi Steven
Bought by
Click Shelia D
Home Financials for this Owner
Home Financials are based on the most recent Mortgage that was taken out on this home.
Original Mortgage
$199,600
Interest Rate
6.16%
Mortgage Type
New Conventional
Create a Home Valuation Report for This Property
The Home Valuation Report is an in-depth analysis detailing your home's value as well as a comparison with similar homes in the area
Home Values in the Area
Average Home Value in this Area
Purchase History
| Date | Buyer | Sale Price | Title Company |
|---|---|---|---|
| Rockport Condo Llc | -- | None Available | |
| Roy Berton G | -- | -- | |
| Click Shelia D | -- | -- |
Source: Public Records
Mortgage History
| Date | Status | Borrower | Loan Amount |
|---|---|---|---|
| Previous Owner | Roy Berton G | $200,000 | |
| Previous Owner | Click Shelia D | $199,600 |
Source: Public Records
Tax History Compared to Growth
Tax History
| Year | Tax Paid | Tax Assessment Tax Assessment Total Assessment is a certain percentage of the fair market value that is determined by local assessors to be the total taxable value of land and additions on the property. | Land | Improvement |
|---|---|---|---|---|
| 2025 | $6,260 | $393,990 | $64,800 | $329,190 |
| 2024 | $6,040 | $380,130 | $64,800 | $315,330 |
| 2023 | $4,929 | $322,710 | $64,800 | $257,910 |
| 2022 | $5,781 | $325,500 | $64,800 | $260,700 |
| 2021 | $5,626 | $298,450 | $64,800 | $233,650 |
| 2020 | $4,689 | $240,030 | $64,800 | $175,230 |
| 2019 | $2,107 | $191,260 | $64,800 | $126,460 |
| 2018 | $2,107 | $105,160 | $64,800 | $40,360 |
| 2017 | $4,620 | $229,100 | $64,800 | $164,300 |
| 2014 | -- | $232,740 | $64,800 | $167,940 |
Source: Public Records
Map
Nearby Homes
- 508 Lauderdale Dr
- 911 Sandollar St
- 905 Sandollar St
- 910 Sandollar St
- 609 Lauderdale Dr
- 42 Nassau Dr
- 903 Sandollar St
- 30 Nassau Dr
- 32 Nassau Dr
- 907 Sandollar St
- 24 Nassau Dr
- 14 Jamaica Dr
- 701 Lauderdale Dr
- 708 Lauderdale Dr
- 28 Sandollar St Unit F
- 28 Sandollar St Unit C2
- 709 Lauderdale Dr
- 706 Lauderdale Dr
- 1837 Bay Shore Dr
- 1833 Bay Shore Dr
- 403 Nassau Dr
- 402 Nassau Dr
- 406 Nassau Dr
- 404 Nassau Dr
- 401 Nassau Dr
- 405 Nassau Dr
- 304 Nassau Dr
- 301 Nassau Dr
- 303 Nassau Dr
- 302 Nassau Dr
- 501 Lauderdale Dr
- 506 Lauderdale Dr
- 505 Lauderdale Dr
- 503 Lauderdale Dr
- 507 Lauderdale Dr
- 502 Lauderdale Dr
- 55 Nassau Dr Unit DR
- 55 Nassau Dr
- 208 Nassau Dr
- 57 Nassau Dr