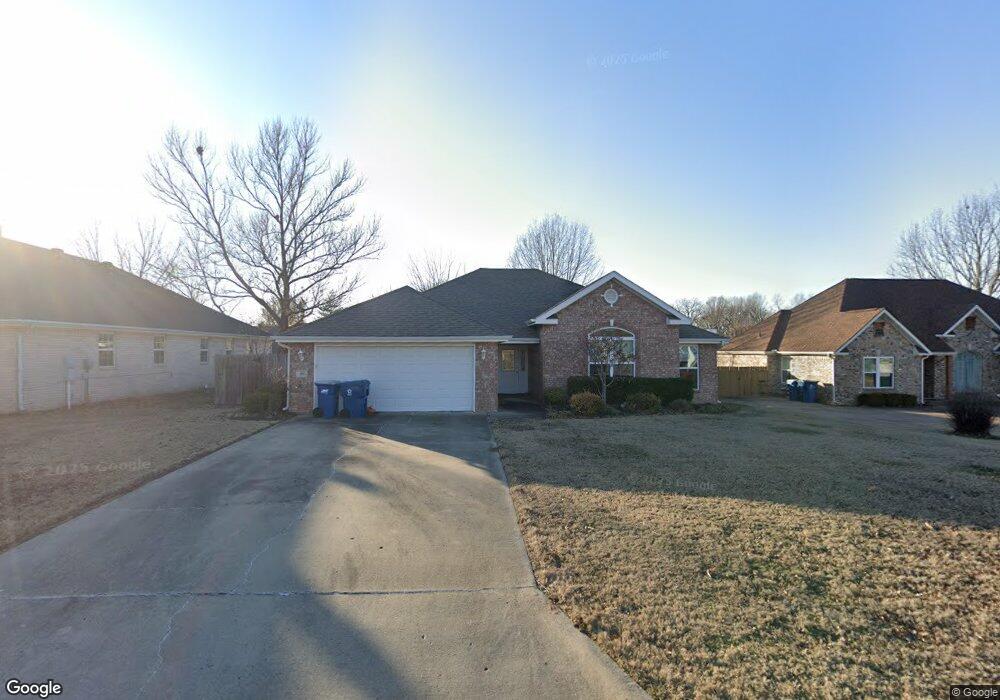
403 Old Forge Dr Bentonville, AR 72712
Estimated Value: $452,000 - $491,000
4
Beds
2
Baths
1,990
Sq Ft
$238/Sq Ft
Est. Value
About This Home
This home is located at 403 Old Forge Dr, Bentonville, AR 72712 and is currently estimated at $473,904, approximately $238 per square foot. 403 Old Forge Dr is a home located in Benton County with nearby schools including Thomas Jefferson Elementary School, Lincoln Junior High School, and Ardis Ann Middle School.
Ownership History
Date
Name
Owned For
Owner Type
Purchase Details
Closed on
Oct 21, 2009
Sold by
Vanlaar Tifanie L
Bought by
Swim Jason and Swim Carla Nicole
Current Estimated Value
Home Financials for this Owner
Home Financials are based on the most recent Mortgage that was taken out on this home.
Original Mortgage
$130,900
Outstanding Balance
$85,257
Interest Rate
5.03%
Estimated Equity
$388,647
Purchase Details
Closed on
Jan 5, 2005
Sold by
Jones Todd L
Bought by
Laar Tifanie L Van
Purchase Details
Closed on
Dec 7, 2001
Bought by
Jones
Purchase Details
Closed on
Mar 3, 2000
Bought by
Ellison
Purchase Details
Closed on
May 1, 1996
Bought by
Stamper
Purchase Details
Closed on
Apr 14, 1995
Bought by
P-B Ent Inc
Create a Home Valuation Report for This Property
The Home Valuation Report is an in-depth analysis detailing your home's value as well as a comparison with similar homes in the area
Home Values in the Area
Average Home Value in this Area
Purchase History
| Date | Buyer | Sale Price | Title Company |
|---|---|---|---|
| Swim Jason | $170,000 | None Available | |
| Laar Tifanie L Van | -- | None Available | |
| Jones | $146,000 | -- | |
| Ellison | $141,000 | -- | |
| Stamper | $145,000 | -- | |
| P-B Ent Inc | $19,000 | -- |
Source: Public Records
Mortgage History
| Date | Status | Borrower | Loan Amount |
|---|---|---|---|
| Open | Swim Jason | $130,900 |
Source: Public Records
Tax History Compared to Growth
Tax History
| Year | Tax Paid | Tax Assessment Tax Assessment Total Assessment is a certain percentage of the fair market value that is determined by local assessors to be the total taxable value of land and additions on the property. | Land | Improvement |
|---|---|---|---|---|
| 2025 | $3,088 | $76,872 | $24,000 | $52,872 |
| 2024 | $2,961 | $76,872 | $24,000 | $52,872 |
| 2023 | $2,820 | $47,570 | $11,400 | $36,170 |
| 2022 | $2,388 | $47,570 | $11,400 | $36,170 |
| 2021 | $2,254 | $47,570 | $11,400 | $36,170 |
| 2020 | $2,153 | $39,690 | $7,400 | $32,290 |
| 2019 | $2,153 | $39,690 | $7,400 | $32,290 |
| 2018 | $2,081 | $39,690 | $7,400 | $32,290 |
| 2017 | $1,800 | $39,690 | $7,400 | $32,290 |
| 2016 | $1,800 | $39,690 | $7,400 | $32,290 |
| 2015 | $2,051 | $33,180 | $8,100 | $25,080 |
| 2014 | $1,701 | $33,180 | $8,100 | $25,080 |
Source: Public Records
Map
Nearby Homes
- 312 NW J St
- 1110 NW 7th St
- 0 NW Olinka Pass St
- 315 NW O St
- 703 NW J St
- 103 NW J St
- 701 NW Ford Ln
- 411 NW Saddlebrook Dr
- 1002 NW 9th St
- 3631 Bitterroot Cove
- 912 NW 9th St
- 1201 NW 10th St
- Lot 2 NW G St
- Lot 1 NW G St
- Lot 1 & Lot 2 NW G St
- 722 NW 6th St
- Lot 8 NW H St
- Lot 7 NW H St
- Lot 7 & 8 NW H St
- 214 El Contento Dr
- 405 Old Forge Dr
- 1302 Barberry Ln
- 402 Grist Mill
- L30 Barberry Ln
- 402 Gristmill
- 310 Grist Mill
- 400 Grist Mill
- 404 Grist Mill
- 404 Gristmill
- 400 Gristmill
- 407 Old Forge Dr
- 752 Old Forge Dr
- -- Barberry Ln L30
- 402 Old Forge Dr
- 400 Old Forge Dr
- 406 Grist Mill
- 406 Gristmill
- 404 Old Forge Dr
- 310 Old Forge Dr
- 307 Old Forge Dr