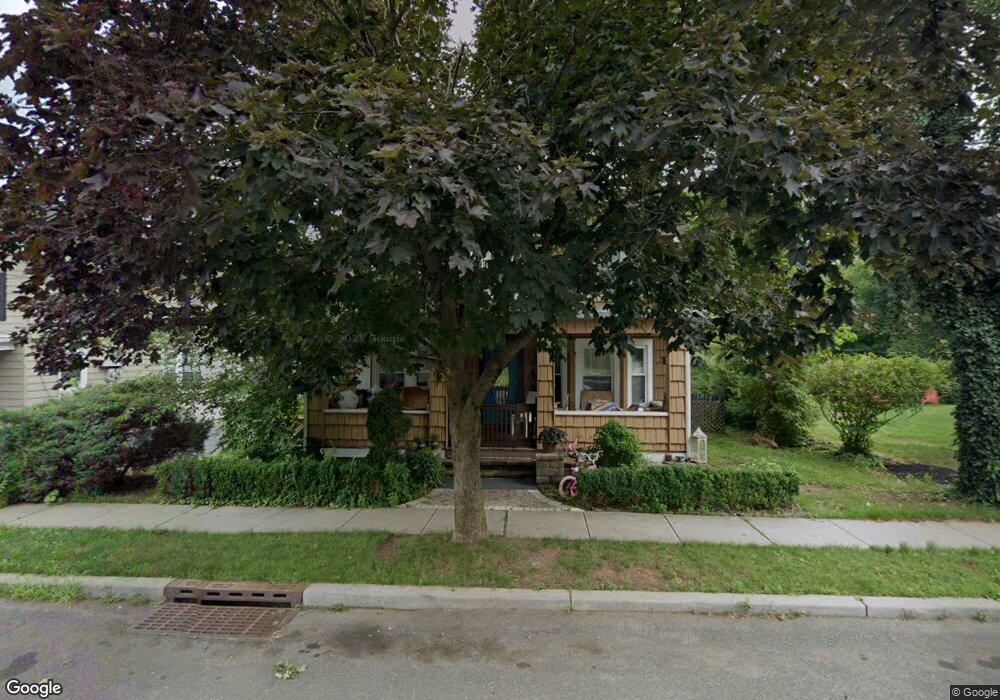
403 Olive St Branchburg, NJ 08853
Branchburg Township NeighborhoodEstimated Value: $354,000 - $448,000
--
Bed
--
Bath
1,414
Sq Ft
$275/Sq Ft
Est. Value
About This Home
This home is located at 403 Olive St, Branchburg, NJ 08853 and is currently estimated at $389,422, approximately $275 per square foot. 403 Olive St is a home located in Somerset County with nearby schools including Whiton Elementary School, Stony Brook School, and Branchburg Central Middle School.
Ownership History
Date
Name
Owned For
Owner Type
Purchase Details
Closed on
Feb 6, 2025
Sold by
Vargas Jose
Bought by
Acosta Emilio J and Acosta Maritza I
Current Estimated Value
Home Financials for this Owner
Home Financials are based on the most recent Mortgage that was taken out on this home.
Original Mortgage
$350,000
Outstanding Balance
$340,658
Interest Rate
4.92%
Mortgage Type
New Conventional
Estimated Equity
$48,764
Purchase Details
Closed on
Dec 11, 2002
Sold by
Glen Donna
Bought by
Vargas Jose
Home Financials for this Owner
Home Financials are based on the most recent Mortgage that was taken out on this home.
Original Mortgage
$201,600
Interest Rate
6.17%
Create a Home Valuation Report for This Property
The Home Valuation Report is an in-depth analysis detailing your home's value as well as a comparison with similar homes in the area
Home Values in the Area
Average Home Value in this Area
Purchase History
| Date | Buyer | Sale Price | Title Company |
|---|---|---|---|
| Acosta Emilio J | $350,000 | None Listed On Document | |
| Acosta Emilio J | $350,000 | None Listed On Document | |
| Vargas Jose | $224,000 | -- |
Source: Public Records
Mortgage History
| Date | Status | Borrower | Loan Amount |
|---|---|---|---|
| Open | Acosta Emilio J | $350,000 | |
| Closed | Acosta Emilio J | $350,000 | |
| Previous Owner | Vargas Jose | $201,600 |
Source: Public Records
Tax History Compared to Growth
Tax History
| Year | Tax Paid | Tax Assessment Tax Assessment Total Assessment is a certain percentage of the fair market value that is determined by local assessors to be the total taxable value of land and additions on the property. | Land | Improvement |
|---|---|---|---|---|
| 2025 | $6,608 | $396,200 | $125,600 | $270,600 |
| 2024 | $6,608 | $366,300 | $125,600 | $240,700 |
| 2023 | $6,459 | $345,200 | $125,600 | $219,600 |
| 2022 | $6,360 | $323,000 | $125,600 | $197,400 |
| 2021 | $6,355 | $300,600 | $125,600 | $175,000 |
| 2020 | $6,129 | $286,000 | $125,600 | $160,400 |
| 2019 | $6,129 | $284,400 | $125,600 | $158,800 |
| 2018 | $6,081 | $281,400 | $125,600 | $155,800 |
| 2017 | $6,084 | $279,600 | $122,600 | $157,000 |
| 2016 | $6,104 | $278,700 | $122,600 | $156,100 |
| 2015 | $6,116 | $279,800 | $121,600 | $158,200 |
| 2014 | $6,016 | $278,500 | $121,400 | $157,100 |
Source: Public Records
Map
Nearby Homes