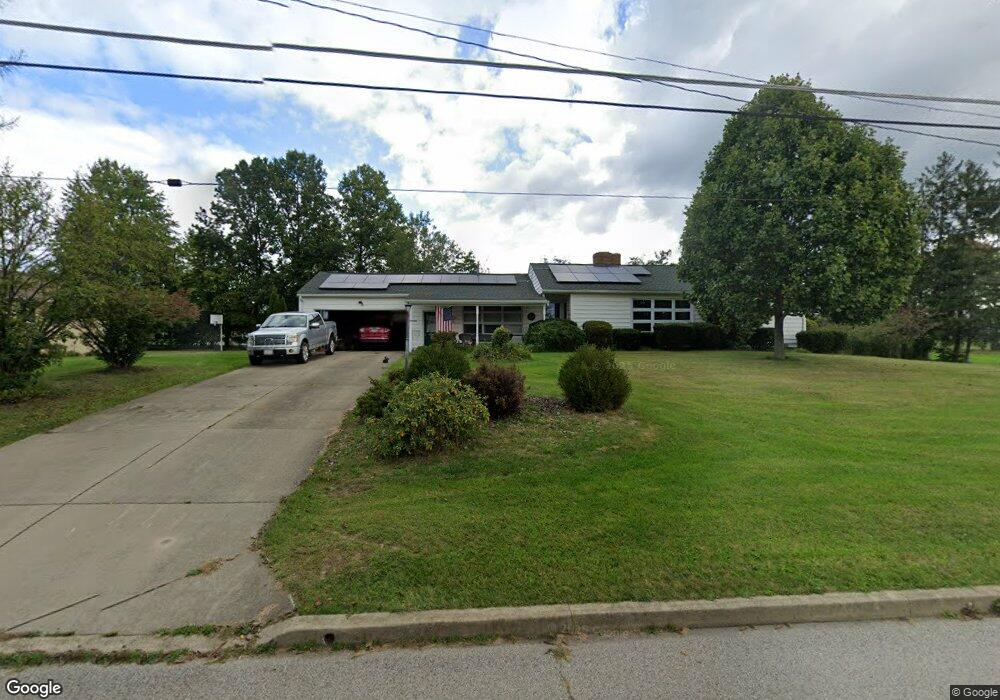
403 Pershing Dr Farrell, PA 16121
Estimated Value: $29,000 - $79,462
--
Bed
--
Bath
300
Sq Ft
$171/Sq Ft
Est. Value
About This Home
This home is located at 403 Pershing Dr, Farrell, PA 16121 and is currently estimated at $51,366, approximately $171 per square foot. 403 Pershing Dr is a home located in Mercer County with nearby schools including Farrell Area Elementary School, Farrell Area High School, and Shenango Valley Faith Academy.
Ownership History
Date
Name
Owned For
Owner Type
Purchase Details
Closed on
Jun 1, 2021
Sold by
Dbmsetates Llc
Bought by
Asche Josiah James
Current Estimated Value
Purchase Details
Closed on
May 1, 2021
Sold by
Surrena Bradley J
Bought by
Dbm Estates Llc
Purchase Details
Closed on
Aug 31, 2020
Sold by
Mook Douglas L
Bought by
Surrena Bradley J
Home Financials for this Owner
Home Financials are based on the most recent Mortgage that was taken out on this home.
Original Mortgage
$24,878
Interest Rate
2.9%
Mortgage Type
New Conventional
Purchase Details
Closed on
Jul 29, 2020
Sold by
Leftheris Matthews Colleen M and Leftheris Colleen M
Bought by
Mook Douglas L and Jefferson Ave Trust
Home Financials for this Owner
Home Financials are based on the most recent Mortgage that was taken out on this home.
Original Mortgage
$24,878
Interest Rate
2.9%
Mortgage Type
New Conventional
Create a Home Valuation Report for This Property
The Home Valuation Report is an in-depth analysis detailing your home's value as well as a comparison with similar homes in the area
Home Values in the Area
Average Home Value in this Area
Purchase History
| Date | Buyer | Sale Price | Title Company |
|---|---|---|---|
| Asche Josiah James | $14,900 | Allegheny Realty Setmnt Llc | |
| Dbm Estates Llc | -- | None Available | |
| Surrena Bradley J | $30,900 | None Available | |
| Mook Douglas L | $9,000 | None Available |
Source: Public Records
Mortgage History
| Date | Status | Borrower | Loan Amount |
|---|---|---|---|
| Previous Owner | Surrena Bradley J | $24,878 | |
| Closed | Dbm Estates Llc | $0 |
Source: Public Records
Tax History Compared to Growth
Tax History
| Year | Tax Paid | Tax Assessment Tax Assessment Total Assessment is a certain percentage of the fair market value that is determined by local assessors to be the total taxable value of land and additions on the property. | Land | Improvement |
|---|---|---|---|---|
| 2025 | $631 | $4,500 | $1,050 | $3,450 |
| 2024 | $631 | $4,500 | $1,050 | $3,450 |
| 2023 | $622 | $4,500 | $1,050 | $3,450 |
| 2022 | $608 | $4,500 | $1,050 | $3,450 |
| 2021 | $599 | $4,500 | $1,050 | $3,450 |
| 2020 | $599 | $4,500 | $1,050 | $3,450 |
| 2019 | $587 | $4,500 | $1,050 | $3,450 |
| 2018 | $574 | $4,500 | $1,050 | $3,450 |
| 2017 | $563 | $4,500 | $1,050 | $3,450 |
| 2016 | -- | $4,500 | $1,050 | $3,450 |
| 2015 | -- | $4,500 | $1,050 | $3,450 |
| 2014 | -- | $4,500 | $1,050 | $3,450 |
Source: Public Records
Map
Nearby Homes
- 409 Patt Dr
- 2085 Debrakeleer Ave
- 0 Hoezle Rd
- 2206 Carolyn St
- 1638 Shady Dr
- 1305 Mercer Ave
- 1611 Roemer Blvd
- 138 Shenango Blvd
- 1620 Maple Dr
- 609 Park Ave
- 2060 Parkdale Ave
- 2019 Parkdale Ave
- 624 Park Ave Unit 626
- 164 Chestnut St
- 115 Fleetwood Ct
- 1228 Washington St
- 1212 Negley St
- 2341 S Hermitage Rd
- 327 Lincoln Ave
- 1350 George St
- 403 Pershing Dr
- 403 Pershing Dr
- 403 Pershing Dr
- 403 Pershing Dr
- 411 Pershing Dr
- 337 Pershing Dr
- 406 Pershing Dr
- 348 Pershing Dr
- 447 Patt Dr
- 442 Sharon New Castle Rd
- 432 Patt Dr
- 438 Patt Dr
- 426 Patt Dr
- 444 Patt Dr
- 329 Pershing Dr
- 336 Pershing Dr
- 438 Sharon New Castle Rd
- 420 Patt Dr
- 434 Sharon New Castle Rd
- 450 Patt Dr