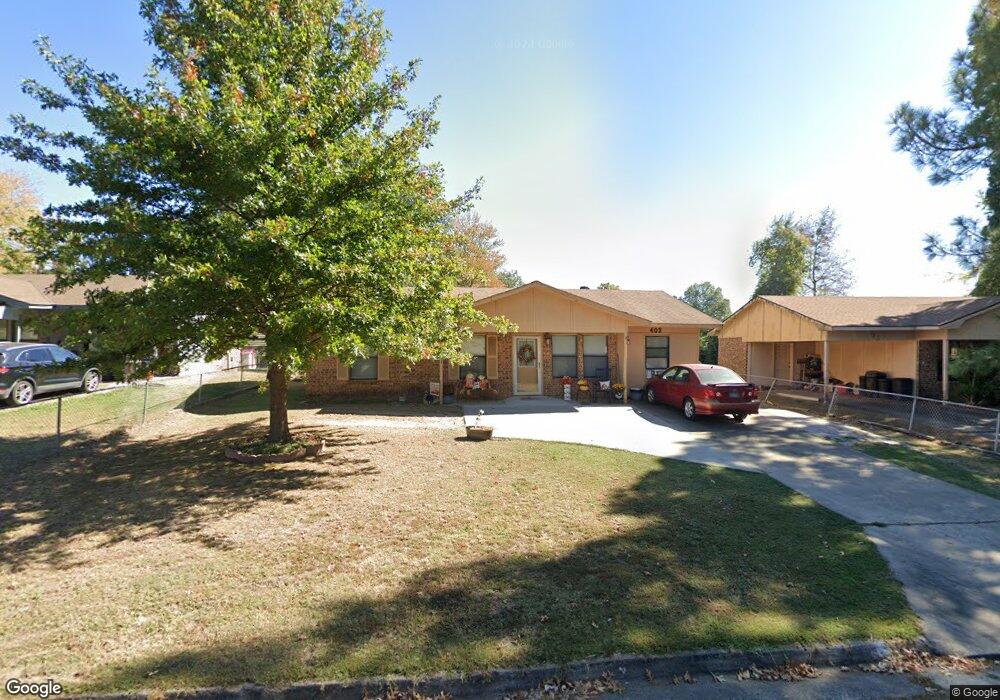
403 S 41st St van Buren, AR 72956
Estimated Value: $132,000 - $147,000
--
Bed
2
Baths
1,426
Sq Ft
$97/Sq Ft
Est. Value
About This Home
This home is located at 403 S 41st St, van Buren, AR 72956 and is currently estimated at $138,465, approximately $97 per square foot. 403 S 41st St is a home located in Crawford County with nearby schools including James R. Tate Elementary School, Butterfield Trail Middle School, and Van Buren High School.
Ownership History
Date
Name
Owned For
Owner Type
Purchase Details
Closed on
Aug 3, 2018
Sold by
Bethel Carolyn
Bought by
Bethel Carolyn and Edwards Teresa
Current Estimated Value
Purchase Details
Closed on
Jul 15, 2005
Sold by
Cantrell Cheryl K Sternberg
Bought by
Bethel Carolyn
Home Financials for this Owner
Home Financials are based on the most recent Mortgage that was taken out on this home.
Original Mortgage
$61,153
Outstanding Balance
$31,679
Interest Rate
5.64%
Mortgage Type
FHA
Estimated Equity
$106,786
Purchase Details
Closed on
Apr 27, 2001
Bought by
Regions-Sternberg
Purchase Details
Closed on
Oct 23, 2000
Bought by
Peters-Regions
Purchase Details
Closed on
Aug 1, 1995
Bought by
Moody-Peters
Purchase Details
Closed on
Apr 19, 1995
Bought by
Swaim-Moody
Create a Home Valuation Report for This Property
The Home Valuation Report is an in-depth analysis detailing your home's value as well as a comparison with similar homes in the area
Home Values in the Area
Average Home Value in this Area
Purchase History
| Date | Buyer | Sale Price | Title Company |
|---|---|---|---|
| Bethel Carolyn | -- | None Available | |
| Bethel Carolyn | -- | -- | |
| Regions-Sternberg | -- | -- | |
| Peters-Regions | -- | -- | |
| Moody-Peters | $44,000 | -- | |
| Swaim-Moody | $8,300 | -- |
Source: Public Records
Mortgage History
| Date | Status | Borrower | Loan Amount |
|---|---|---|---|
| Open | Bethel Carolyn | $61,153 | |
| Closed | Bethel Carolyn | $2,200 |
Source: Public Records
Tax History Compared to Growth
Tax History
| Year | Tax Paid | Tax Assessment Tax Assessment Total Assessment is a certain percentage of the fair market value that is determined by local assessors to be the total taxable value of land and additions on the property. | Land | Improvement |
|---|---|---|---|---|
| 2025 | $324 | $26,500 | $3,000 | $23,500 |
| 2024 | $389 | $26,500 | $3,000 | $23,500 |
| 2023 | $430 | $26,500 | $3,000 | $23,500 |
| 2022 | $315 | $13,300 | $2,000 | $11,300 |
| 2021 | $315 | $13,300 | $2,000 | $11,300 |
| 2020 | $315 | $13,300 | $2,000 | $11,300 |
| 2019 | $315 | $13,300 | $2,000 | $11,300 |
| 2018 | $340 | $13,300 | $2,000 | $11,300 |
| 2017 | $321 | $12,920 | $2,000 | $10,920 |
| 2016 | $321 | $12,920 | $2,000 | $10,920 |
| 2015 | $282 | $12,920 | $2,000 | $10,920 |
| 2014 | $282 | $12,920 | $2,000 | $10,920 |
Source: Public Records
Map
Nearby Homes