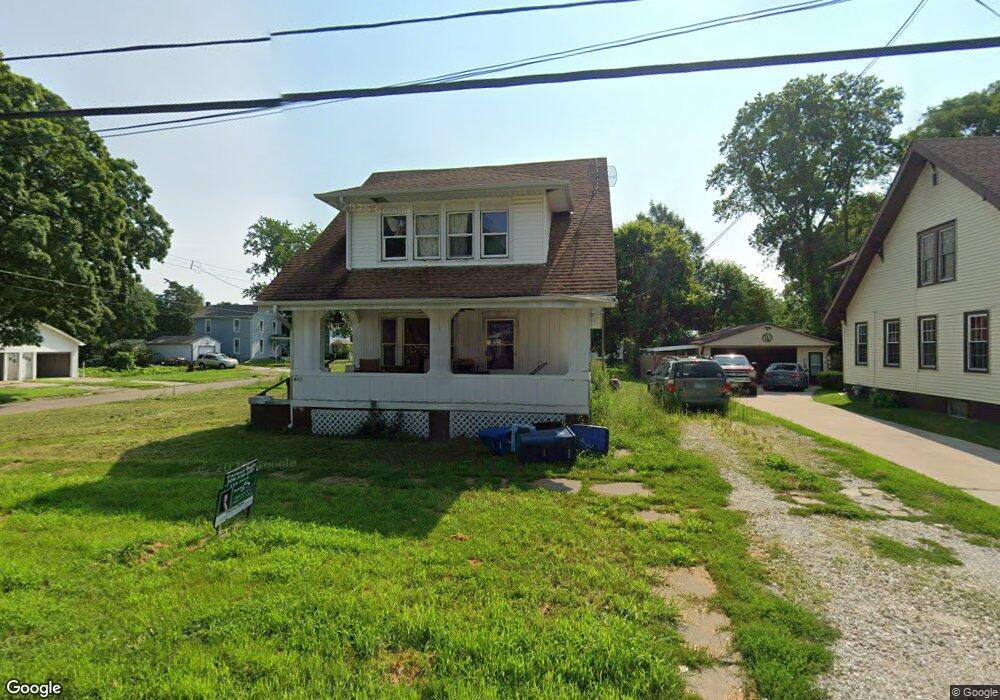
403 S 6th St Unit 2 Monmouth, IL 61462
Estimated Value: $36,000 - $93,000
--
Bed
2
Baths
2,016
Sq Ft
$29/Sq Ft
Est. Value
About This Home
This home is located at 403 S 6th St Unit 2, Monmouth, IL 61462 and is currently estimated at $58,570, approximately $29 per square foot. 403 S 6th St Unit 2 is a home located in Warren County with nearby schools including Lincoln Early Childhood School, Central Intermediate School, and Harding Primary School.
Ownership History
Date
Name
Owned For
Owner Type
Purchase Details
Closed on
Sep 17, 2025
Sold by
Smith Josh
Bought by
Jamieson Community Center
Current Estimated Value
Purchase Details
Closed on
Sep 29, 2015
Sold by
Francis Griffith W
Bought by
Smith Josh
Purchase Details
Closed on
Aug 16, 2012
Sold by
Raritan State Bank
Bought by
Francis Griffith W
Purchase Details
Closed on
Dec 21, 2011
Sold by
Kelso Rodney D and Kelso Kimberly M
Bought by
Raritan State Bank
Purchase Details
Closed on
Oct 27, 2005
Sold by
Deutsche Bank National Trust Company
Bought by
Kelso Rodney D and Kelso Kimberly M
Home Financials for this Owner
Home Financials are based on the most recent Mortgage that was taken out on this home.
Original Mortgage
$19,600
Interest Rate
5.8%
Mortgage Type
New Conventional
Purchase Details
Closed on
Aug 17, 2005
Sold by
Goodley Thomas E and Case #01 Ch 41
Bought by
Deutsche Bank National Trust Company
Create a Home Valuation Report for This Property
The Home Valuation Report is an in-depth analysis detailing your home's value as well as a comparison with similar homes in the area
Home Values in the Area
Average Home Value in this Area
Purchase History
| Date | Buyer | Sale Price | Title Company |
|---|---|---|---|
| Smith Josh | -- | None Available | |
| Francis Griffith W | $20,500 | None Available | |
| Raritan State Bank | -- | None Available | |
| Kelso Rodney D | $22,000 | First American Title | |
| Deutsche Bank National Trust Company | -- | None Available |
Source: Public Records
Mortgage History
| Date | Status | Borrower | Loan Amount |
|---|---|---|---|
| Previous Owner | Kelso Rodney D | $19,600 |
Source: Public Records
Tax History Compared to Growth
Tax History
| Year | Tax Paid | Tax Assessment Tax Assessment Total Assessment is a certain percentage of the fair market value that is determined by local assessors to be the total taxable value of land and additions on the property. | Land | Improvement |
|---|---|---|---|---|
| 2024 | $901 | $8,960 | $2,540 | $6,420 |
| 2023 | $901 | $8,400 | $2,380 | $6,020 |
| 2022 | $822 | $8,020 | $2,270 | $5,750 |
| 2021 | $803 | $7,520 | $2,130 | $5,390 |
| 2020 | $775 | $7,520 | $2,130 | $5,390 |
| 2019 | $747 | $7,320 | $2,070 | $5,250 |
| 2018 | $740 | $7,240 | $2,050 | $5,190 |
| 2017 | $725 | $7,210 | $2,040 | $5,170 |
| 2016 | $696 | $7,210 | $2,040 | $5,170 |
| 2015 | -- | $7,040 | $1,990 | $5,050 |
| 2014 | -- | $6,870 | $1,940 | $4,930 |
| 2013 | -- | $6,560 | $1,850 | $4,710 |
Source: Public Records
Map
Nearby Homes