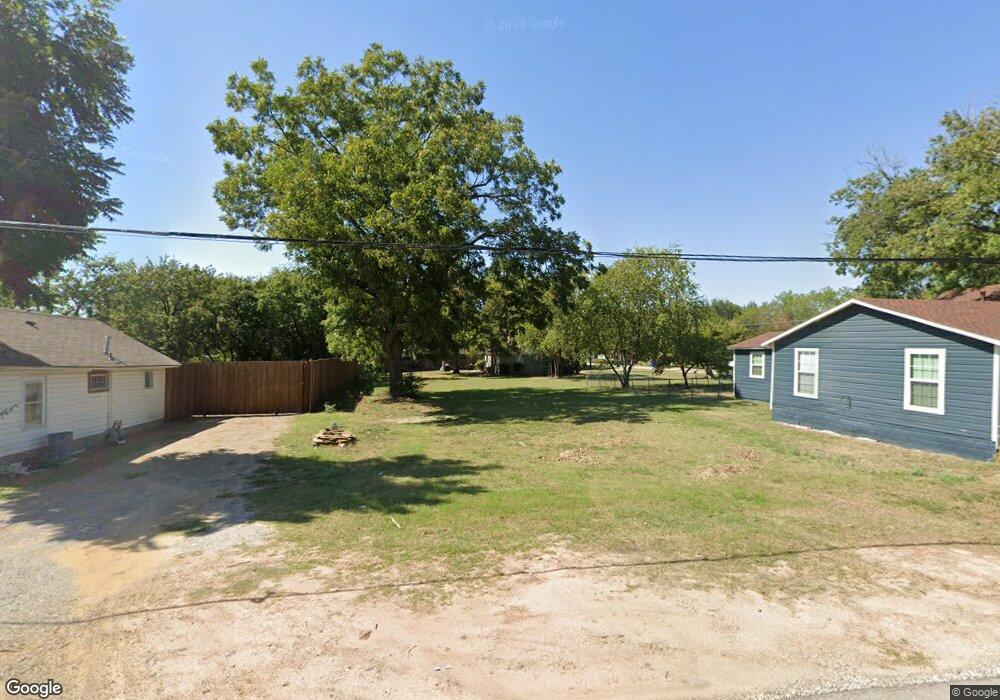
403 S Arizona Dr Celina, TX 75009
Estimated Value: $153,517 - $364,000
3
Beds
1
Bath
868
Sq Ft
$287/Sq Ft
Est. Value
About This Home
This home is located at 403 S Arizona Dr, Celina, TX 75009 and is currently estimated at $249,379, approximately $287 per square foot. 403 S Arizona Dr is a home located in Collin County with nearby schools including Celina Primary School, Marcy B. Lykins Elementary School, and Moore Middle School.
Ownership History
Date
Name
Owned For
Owner Type
Purchase Details
Closed on
Jan 10, 2020
Sold by
Coffey Jeffrey P
Bought by
Saye Larry and Saye Elizabeth
Current Estimated Value
Purchase Details
Closed on
May 13, 2013
Sold by
Anderson Susan Fisher and Pollard Joy
Bought by
Coffey Jeffrey P
Purchase Details
Closed on
Jul 24, 1996
Sold by
Willard Keith R and Willard Stephanie E
Bought by
Fisher Roy R and Fisher Joyce Day
Home Financials for this Owner
Home Financials are based on the most recent Mortgage that was taken out on this home.
Original Mortgage
$30,450
Interest Rate
8.41%
Create a Home Valuation Report for This Property
The Home Valuation Report is an in-depth analysis detailing your home's value as well as a comparison with similar homes in the area
Home Values in the Area
Average Home Value in this Area
Purchase History
| Date | Buyer | Sale Price | Title Company |
|---|---|---|---|
| Saye Larry | -- | Chicago Title | |
| Coffey Jeffrey P | -- | Stewart | |
| Fisher Roy R | -- | -- |
Source: Public Records
Mortgage History
| Date | Status | Borrower | Loan Amount |
|---|---|---|---|
| Previous Owner | Fisher Roy R | $30,450 |
Source: Public Records
Tax History Compared to Growth
Tax History
| Year | Tax Paid | Tax Assessment Tax Assessment Total Assessment is a certain percentage of the fair market value that is determined by local assessors to be the total taxable value of land and additions on the property. | Land | Improvement |
|---|---|---|---|---|
| 2025 | $2,973 | $180,000 | $180,000 | -- |
| 2024 | $2,973 | $144,000 | $150,000 | -- |
| 2023 | $2,973 | $120,000 | $120,000 | $0 |
| 2022 | $1,146 | $50,000 | $50,000 | $0 |
| 2021 | $701 | $30,000 | $30,000 | $0 |
| 2020 | $2,177 | $88,860 | $30,000 | $58,860 |
| 2019 | $2,207 | $86,662 | $30,000 | $56,662 |
| 2018 | $2,261 | $88,409 | $24,000 | $64,409 |
| 2017 | $2,322 | $90,803 | $24,000 | $66,803 |
| 2016 | $1,334 | $51,818 | $11,000 | $40,818 |
| 2015 | $981 | $42,342 | $11,000 | $31,342 |
Source: Public Records
Map
Nearby Homes