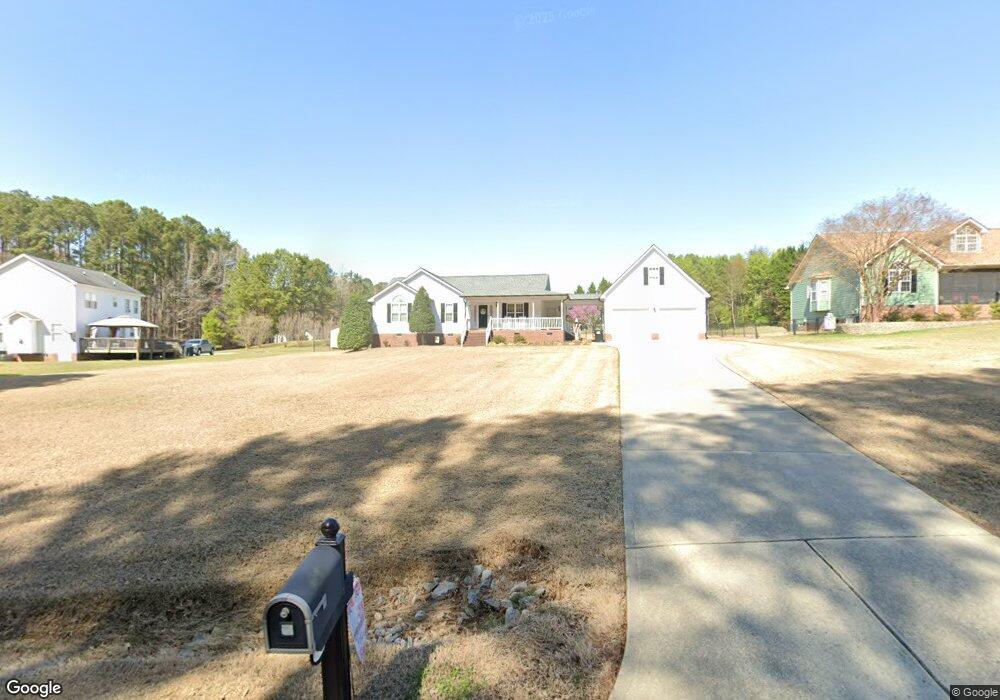
403 S Landing Dr Clayton, NC 27520
Cleveland NeighborhoodEstimated Value: $327,000 - $338,000
3
Beds
2
Baths
1,413
Sq Ft
$234/Sq Ft
Est. Value
About This Home
This home is located at 403 S Landing Dr, Clayton, NC 27520 and is currently estimated at $330,821, approximately $234 per square foot. 403 S Landing Dr is a home located in Johnston County with nearby schools including Cleveland Elementary School, Cleveland Middle School, and Cleveland High School.
Ownership History
Date
Name
Owned For
Owner Type
Purchase Details
Closed on
Aug 28, 2017
Sold by
Jones Charles E and Jones Karen E
Bought by
Jones Charles E and Jones Karen E
Current Estimated Value
Purchase Details
Closed on
Nov 9, 2016
Sold by
Robinson Ryan B and Robinson Leigh Anne
Bought by
Jones Charles E and Jones Karen E
Home Financials for this Owner
Home Financials are based on the most recent Mortgage that was taken out on this home.
Original Mortgage
$166,250
Interest Rate
3.42%
Mortgage Type
New Conventional
Create a Home Valuation Report for This Property
The Home Valuation Report is an in-depth analysis detailing your home's value as well as a comparison with similar homes in the area
Home Values in the Area
Average Home Value in this Area
Purchase History
| Date | Buyer | Sale Price | Title Company |
|---|---|---|---|
| Jones Charles E | -- | Smartdeeds | |
| Jones Charles E | $175,000 | None Available |
Source: Public Records
Mortgage History
| Date | Status | Borrower | Loan Amount |
|---|---|---|---|
| Previous Owner | Jones Charles E | $166,250 |
Source: Public Records
Tax History Compared to Growth
Tax History
| Year | Tax Paid | Tax Assessment Tax Assessment Total Assessment is a certain percentage of the fair market value that is determined by local assessors to be the total taxable value of land and additions on the property. | Land | Improvement |
|---|---|---|---|---|
| 2025 | $1,931 | $304,160 | $69,300 | $234,860 |
| 2024 | $1,493 | $184,380 | $55,440 | $128,940 |
| 2023 | $1,443 | $184,380 | $55,440 | $128,940 |
| 2022 | $1,517 | $184,380 | $55,440 | $128,940 |
| 2021 | $1,517 | $184,380 | $55,440 | $128,940 |
| 2020 | $1,535 | $184,380 | $55,440 | $128,940 |
| 2019 | $1,535 | $184,380 | $55,440 | $128,940 |
| 2018 | $1,212 | $142,160 | $29,570 | $112,590 |
| 2017 | $1,212 | $142,160 | $29,570 | $112,590 |
| 2016 | $1,216 | $142,160 | $29,570 | $112,590 |
| 2015 | $1,212 | $142,160 | $29,570 | $112,590 |
| 2014 | $1,212 | $142,160 | $29,570 | $112,590 |
Source: Public Records
Map
Nearby Homes
- 619 Rudy Dr
- 164 George Wilton Dr
- 211 Mary Sandra Place
- 117 Primrose Ln
- 86 Troy Dr
- 147 E Wellesley Dr
- 208 Hunting Lodge Rd
- 4806 Lee Dr
- 168 Newport Landing
- 590 Glenkirk Place
- 587 Glenkirk Place
- 572 Glenkirk Place
- 206 Merrifield Ln
- 120 Newport Landing Unit 99
- 93 Kinsale Ct
- 84 Commons Cir
- 167 Merrifield Ln Unit 121
- The Buford II Plan at Wellesley
- The Harrington Plan at Wellesley
- The Caldwell Plan at Wellesley