403 S Lee St Lagrange, GA 30240
Estimated Value: $86,000 - $118,000
3
Beds
1
Bath
1,058
Sq Ft
$95/Sq Ft
Est. Value
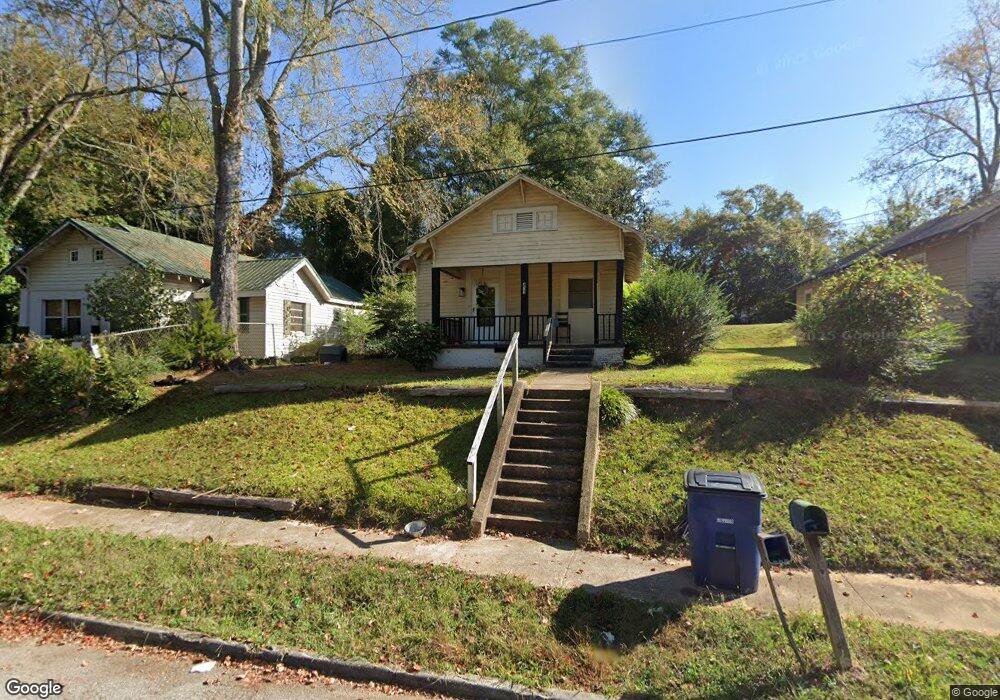
About This Home
This home is located at 403 S Lee St, Lagrange, GA 30240 and is currently estimated at $100,395, approximately $94 per square foot. 403 S Lee St is a home located in Troup County with nearby schools including Ethel W. Kight Elementary School, Hollis Hand Elementary School, and Franklin Forest Elementary School.
Ownership History
Date
Name
Owned For
Owner Type
Purchase Details
Closed on
Nov 30, 2021
Sold by
T Squared 1 Llc
Bought by
Brbrshy Investments Inc
Current Estimated Value
Purchase Details
Closed on
Jun 1, 2021
Sold by
Stribling Ty
Bought by
T Squared 1 Llc
Purchase Details
Closed on
Aug 15, 1996
Sold by
Thomas W Whatley
Bought by
Stribling Ty
Purchase Details
Closed on
Jul 30, 1987
Sold by
Waters Frank Aka Waters Frank-
Bought by
Thomas W Whatley
Purchase Details
Closed on
Apr 1, 1987
Sold by
Waters Frank and Waters Valerie
Bought by
Waters Frank Aka Waters Frank-
Purchase Details
Closed on
Mar 13, 1985
Sold by
Morrow Bobby Ray and Morrow Patricia A
Bought by
Waters Frank and Waters Valerie
Purchase Details
Closed on
Mar 12, 1985
Sold by
Moore Madeline
Bought by
Morrow Bobby Ray and Morrow Patricia A
Purchase Details
Closed on
Mar 14, 1983
Sold by
Moore Madeline
Bought by
Moore Madeline
Purchase Details
Closed on
Nov 17, 1981
Sold by
Commercial Bank & Trust Co
Bought by
Moore Madeline
Purchase Details
Closed on
Jul 22, 1977
Sold by
Gallant James G
Bought by
Commercial Bank & Trust Co
Purchase Details
Closed on
May 1, 1966
Sold by
Moman Nassie Lee
Bought by
Gallant James G
Create a Home Valuation Report for This Property
The Home Valuation Report is an in-depth analysis detailing your home's value as well as a comparison with similar homes in the area
Home Values in the Area
Average Home Value in this Area
Purchase History
| Date | Buyer | Sale Price | Title Company |
|---|---|---|---|
| Brbrshy Investments Inc | $12,484,500 | -- | |
| T Squared 1 Llc | -- | -- | |
| Stribling Ty | $6,000 | -- | |
| Thomas W Whatley | $15,000 | -- | |
| Waters Frank Aka Waters Frank- | -- | -- | |
| Waters Frank | $14,000 | -- | |
| Morrow Bobby Ray | -- | -- | |
| Moore Madeline | $3,500 | -- | |
| Moore Madeline | $9,500 | -- | |
| Commercial Bank & Trust Co | $38,500 | -- | |
| Gallant James G | -- | -- |
Source: Public Records
Tax History Compared to Growth
Tax History
| Year | Tax Paid | Tax Assessment Tax Assessment Total Assessment is a certain percentage of the fair market value that is determined by local assessors to be the total taxable value of land and additions on the property. | Land | Improvement |
|---|---|---|---|---|
| 2024 | $705 | $25,840 | $2,720 | $23,120 |
| 2023 | $483 | $17,720 | $2,720 | $15,000 |
| 2022 | $470 | $16,840 | $2,720 | $14,120 |
| 2021 | $220 | $7,280 | $2,720 | $4,560 |
| 2020 | $220 | $7,280 | $2,720 | $4,560 |
| 2019 | $199 | $6,600 | $2,200 | $4,400 |
| 2018 | $193 | $6,388 | $1,988 | $4,400 |
| 2017 | $193 | $6,388 | $1,988 | $4,400 |
| 2016 | $208 | $6,890 | $1,988 | $4,902 |
| 2015 | $211 | $6,970 | $2,068 | $4,902 |
| 2014 | $211 | $6,970 | $2,068 | $4,902 |
| 2013 | -- | $9,580 | $2,758 | $6,822 |
Source: Public Records
Map
Nearby Homes