Estimated Value: $395,000 - $479,000
4
Beds
2
Baths
2,235
Sq Ft
$199/Sq Ft
Est. Value
About This Home
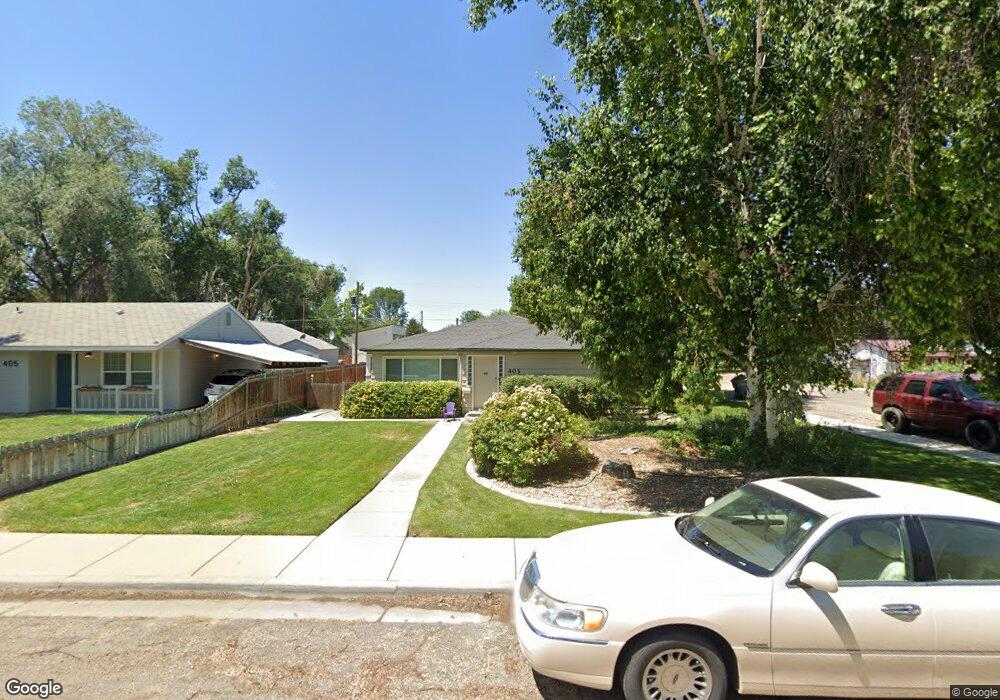
This home is located at 403 S Locust St, Nampa, ID 83686 and is currently estimated at $443,712, approximately $198 per square foot. 403 S Locust St is a home located in Canyon County with nearby schools including Sherman Elementary School, West Middle School, and Nampa Senior High School.
Ownership History
Date
Name
Owned For
Owner Type
Purchase Details
Closed on
Aug 15, 2017
Sold by
Moro Llc
Bought by
Local Improvement District Guarantee Fun
Current Estimated Value
Purchase Details
Closed on
Sep 10, 2012
Sold by
Warnock Sara Rose
Bought by
Moro Llc
Purchase Details
Closed on
Aug 7, 2012
Sold by
Warnock Robert Bryan
Bought by
Moro Llc
Purchase Details
Closed on
Aug 20, 2010
Sold by
Warnock Robert Bryan
Bought by
Warnock Robert Bryan and Warnock Sarah R
Purchase Details
Closed on
Aug 18, 2010
Sold by
Federal Home Loan Mortgage Corporation
Bought by
Warnock Robert Bryan
Purchase Details
Closed on
Jun 29, 2010
Sold by
Davies Glendon H
Bought by
Federal Home Loan Mortgage Corp
Purchase Details
Closed on
Apr 22, 2010
Sold by
Davis Don
Bought by
Local Improvement District Guarantee Fun
Purchase Details
Closed on
Jan 22, 2010
Sold by
Davies Don
Bought by
Local Improvement District Guarantee Fun
Create a Home Valuation Report for This Property
The Home Valuation Report is an in-depth analysis detailing your home's value as well as a comparison with similar homes in the area
Home Values in the Area
Average Home Value in this Area
Purchase History
| Date | Buyer | Sale Price | Title Company |
|---|---|---|---|
| Local Improvement District Guarantee Fun | $219 | None Available | |
| Moro Llc | -- | None Available | |
| Moro Llc | -- | None Available | |
| Warnock Robert Bryan | -- | Stewart Title Emerald O | |
| Warnock Robert Bryan | -- | Stewart Title Emerald O | |
| Federal Home Loan Mortgage Corp | $100,769 | Pioneer Caldwell | |
| Local Improvement District Guarantee Fun | -- | None Available | |
| Local Improvement District Guarantee Fun | $190 | None Available |
Source: Public Records
Tax History Compared to Growth
Tax History
| Year | Tax Paid | Tax Assessment Tax Assessment Total Assessment is a certain percentage of the fair market value that is determined by local assessors to be the total taxable value of land and additions on the property. | Land | Improvement |
|---|---|---|---|---|
| 2025 | $3,474 | $503,600 | $115,000 | $388,600 |
| 2024 | $3,474 | $485,700 | $103,300 | $382,400 |
| 2023 | $3,548 | $471,000 | $103,300 | $367,700 |
| 2022 | $3,165 | $428,800 | $115,000 | $313,800 |
| 2021 | $3,725 | $316,200 | $64,500 | $251,700 |
| 2020 | $3,418 | $263,930 | $55,630 | $208,300 |
| 2019 | $3,848 | $239,780 | $48,380 | $191,400 |
| 2018 | $3,556 | $0 | $0 | $0 |
| 2017 | $3,129 | $0 | $0 | $0 |
| 2016 | $2,750 | $0 | $0 | $0 |
| 2015 | $2,769 | $0 | $0 | $0 |
| 2014 | $2,347 | $120,400 | $17,500 | $102,900 |
Source: Public Records
Map
Nearby Homes
- 219 S Locust St
- TBD Maple St
- 115 E Clark Ave
- 711 Nectarine St
- 712 E Sheridan Ave
- 1017 S Maple St
- 1020 S Maple St
- 1107 15th Ave S
- 1111 13th Ave S
- 107 S Olive St
- 218 W Roosevelt Ave
- 1410 10th Ave S
- 336 W Sheridan Ave
- 335 W Lincoln Ave
- 223 S Elder St
- 923 13th St S
- 814 14th Ave S
- 1119 10th Ave S
- 1024 10th Ave S
- 428 W Washington Ave
- 405 S Locust St
- 411 S Locust St
- 311 E Sherman Ave
- 323 S Locust St
- 415 S Locust St
- 408 Maple St
- 319 S Locust St
- 312 E Sherman Ave
- 412 Maple St
- 408 Maple St
- 404 Maple St
- 419 S Locust St
- 416 Maple St
- 404 S Locust St
- 304 E Sherman Ave
- 408 S Locust St
- 315 S Locust St
- 404 E Sherman Ave
- 412 S Locust St
- 316 E Sheridan Ave