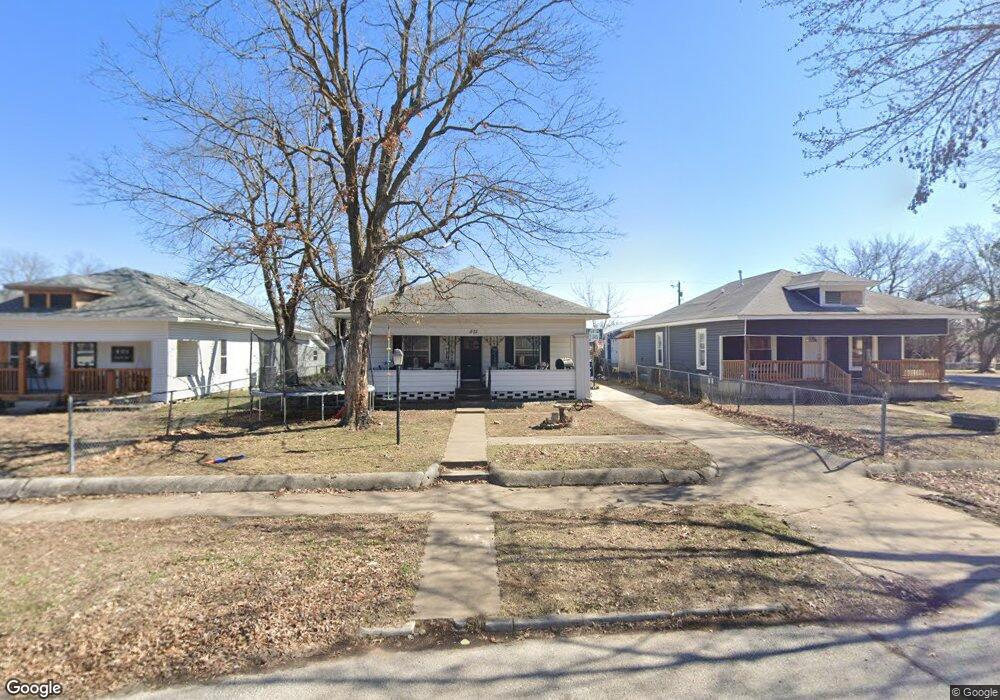
403 S Main St Carl Junction, MO 64834
Estimated Value: $115,000 - $170,000
3
Beds
2
Baths
1,400
Sq Ft
$102/Sq Ft
Est. Value
About This Home
This home is located at 403 S Main St, Carl Junction, MO 64834 and is currently estimated at $143,053, approximately $102 per square foot. 403 S Main St is a home located in Jasper County with nearby schools including Carl Junction Primary School (K-1), Carl Junction Intermediate School, and Carl Junction Primary School (2-3).
Ownership History
Date
Name
Owned For
Owner Type
Purchase Details
Closed on
Jun 26, 2018
Sold by
Terry Jeffrey and Washburn Abby
Bought by
Tyler-Starkey Jeffrey and Starkey Glenda E
Current Estimated Value
Home Financials for this Owner
Home Financials are based on the most recent Mortgage that was taken out on this home.
Original Mortgage
$61,809
Outstanding Balance
$35,128
Interest Rate
4.12%
Mortgage Type
FHA
Estimated Equity
$107,925
Purchase Details
Closed on
Nov 21, 2014
Sold by
Burger Bradley K and Burger Sheila M
Bought by
Terry Jeffrey and Washburn Abby
Home Financials for this Owner
Home Financials are based on the most recent Mortgage that was taken out on this home.
Original Mortgage
$55,000
Interest Rate
4.14%
Mortgage Type
New Conventional
Purchase Details
Closed on
Jun 4, 2007
Sold by
Bowman Ruth
Bought by
Bowman Ruth and Ruth Bowman Trust
Create a Home Valuation Report for This Property
The Home Valuation Report is an in-depth analysis detailing your home's value as well as a comparison with similar homes in the area
Purchase History
| Date | Buyer | Sale Price | Title Company |
|---|---|---|---|
| Tyler-Starkey Jeffrey | -- | -- | |
| Terry Jeffrey | -- | None Available | |
| Bowman Ruth | -- | None Available |
Source: Public Records
Mortgage History
| Date | Status | Borrower | Loan Amount |
|---|---|---|---|
| Open | Tyler-Starkey Jeffrey | $61,809 | |
| Previous Owner | Terry Jeffrey | $55,000 |
Source: Public Records
Tax History
| Year | Tax Paid | Tax Assessment Tax Assessment Total Assessment is a certain percentage of the fair market value that is determined by local assessors to be the total taxable value of land and additions on the property. | Land | Improvement |
|---|---|---|---|---|
| 2025 | $492 | $9,460 | $670 | $8,790 |
| 2024 | $495 | $8,400 | $670 | $7,730 |
| 2023 | $495 | $8,400 | $670 | $7,730 |
| 2022 | $506 | $8,570 | $670 | $7,900 |
| 2021 | $434 | $8,570 | $670 | $7,900 |
| 2020 | $405 | $7,860 | $670 | $7,190 |
| 2019 | $384 | $7,860 | $670 | $7,190 |
| 2018 | $385 | $7,880 | $0 | $0 |
| 2017 | $386 | $7,880 | $0 | $0 |
| 2016 | $383 | $7,910 | $0 | $0 |
Source: Public Records
Map
Nearby Homes
- 503 S Main St
- 501 S Cowgill St
- 406 W Walton Ave
- 410 Walton St
- 608 Valley View St
- 509 W Gault St
- 809 Aberdeen Ave
- 901 Aberdeen Ave
- 604 Pennell St
- TBD Temple St
- 720 Sheridan Ave
- 505 N Broadway Ave
- 817 Delaney Dr
- 307 Ashmore St
- 304 Belgian Blue Blvd
- 900 Aberdeen Ave
- 120 Concord St
- Tract 3 Prairie Ln
- Tract 2 Prairie Ln
- Tract 1 Prairie Ln
Your Personal Tour Guide
Ask me questions while you tour the home.