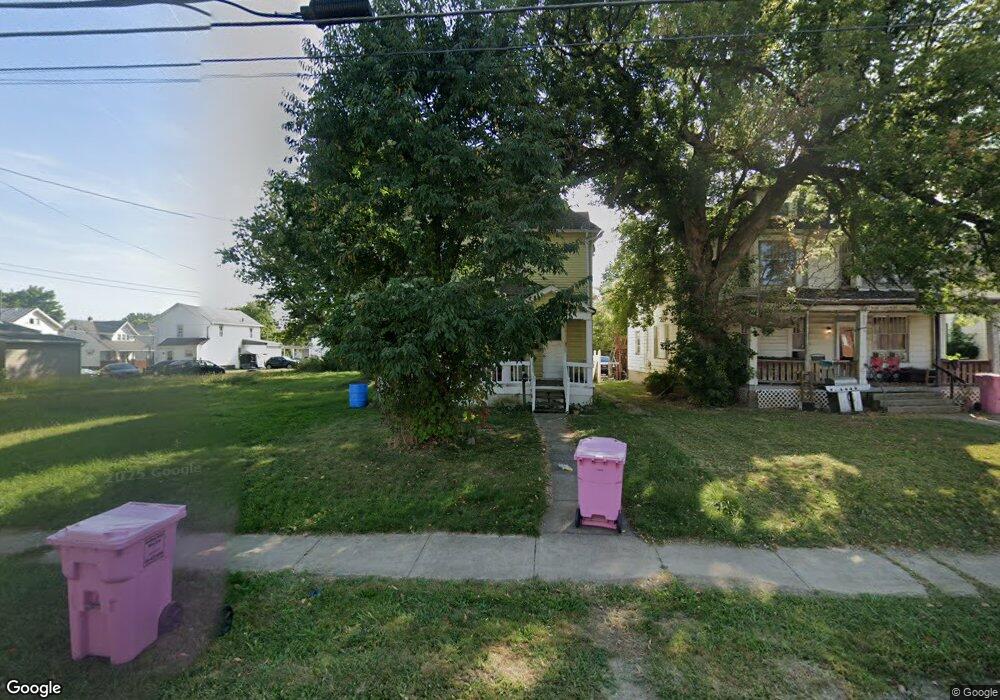
403 S Main St Unit 405 Mansfield, OH 44907
Estimated Value: $118,176 - $160,000
4
Beds
2
Baths
2,236
Sq Ft
$61/Sq Ft
Est. Value
About This Home
This home is located at 403 S Main St Unit 405, Mansfield, OH 44907 and is currently estimated at $137,294, approximately $61 per square foot. 403 S Main St Unit 405 is a home located in Richland County with nearby schools including St. Peter's Elementary/Montessori School, St. Peter's High School/Junior High, and Discovery School.
Ownership History
Date
Name
Owned For
Owner Type
Purchase Details
Closed on
Jul 24, 2024
Sold by
Moton Jerry and Moton Chasity J
Bought by
Club Exclusive Llc
Current Estimated Value
Home Financials for this Owner
Home Financials are based on the most recent Mortgage that was taken out on this home.
Original Mortgage
$105,000
Outstanding Balance
$103,736
Interest Rate
6.95%
Mortgage Type
New Conventional
Estimated Equity
$33,558
Purchase Details
Closed on
Jan 25, 2019
Sold by
Hardrick Ricky
Bought by
Moton Jerry
Purchase Details
Closed on
Aug 13, 2018
Sold by
Dotson Glenna M and Hernandez Glenna M
Bought by
Hardrick Ricky
Purchase Details
Closed on
Jul 11, 2018
Sold by
Dotson Glenna M and Hernandez Glenna M
Bought by
Hardwick Ricky
Purchase Details
Closed on
Jul 28, 2005
Sold by
Brady Carol
Bought by
Hardrick Ricky and Dotson Glenna
Purchase Details
Closed on
Mar 5, 1993
Sold by
Graser Levie F
Bought by
Graser Elizabeth A
Purchase Details
Closed on
Jan 1, 1985
Create a Home Valuation Report for This Property
The Home Valuation Report is an in-depth analysis detailing your home's value as well as a comparison with similar homes in the area
Home Values in the Area
Average Home Value in this Area
Purchase History
| Date | Buyer | Sale Price | Title Company |
|---|---|---|---|
| Club Exclusive Llc | -- | Tha Title | |
| Moton Jerry | $4,382 | None Available | |
| Hardrick Ricky | -- | None Available | |
| Hardwick Ricky | -- | None Available | |
| Hardrick Ricky | $4,602 | None Available | |
| Graser Elizabeth A | -- | -- | |
| -- | $25,600 | -- |
Source: Public Records
Mortgage History
| Date | Status | Borrower | Loan Amount |
|---|---|---|---|
| Open | Club Exclusive Llc | $105,000 |
Source: Public Records
Tax History Compared to Growth
Tax History
| Year | Tax Paid | Tax Assessment Tax Assessment Total Assessment is a certain percentage of the fair market value that is determined by local assessors to be the total taxable value of land and additions on the property. | Land | Improvement |
|---|---|---|---|---|
| 2024 | $1,212 | $25,320 | $2,540 | $22,780 |
| 2023 | $1,212 | $25,320 | $2,540 | $22,780 |
| 2022 | $946 | $16,560 | $2,450 | $14,110 |
| 2021 | $953 | $16,560 | $2,450 | $14,110 |
| 2020 | $968 | $16,450 | $2,340 | $14,110 |
| 2019 | $895 | $14,040 | $1,980 | $12,060 |
| 2018 | $883 | $14,040 | $1,980 | $12,060 |
| 2017 | $868 | $14,040 | $1,980 | $12,060 |
| 2016 | $877 | $13,890 | $2,360 | $11,530 |
| 2015 | $837 | $13,890 | $2,360 | $11,530 |
| 2014 | $826 | $13,890 | $2,360 | $11,530 |
| 2012 | $662 | $14,610 | $2,480 | $12,130 |
Source: Public Records
Map
Nearby Homes
- 394 S Main St
- 327 Hammond Ave
- 69 Reba Ave
- 137 Lexington Ave
- 319 Altamont Ave
- 172 -172 1 2 Lexington Ave
- 286 S Main St
- 120 Grover St
- 259 S Main St
- 0 Cline Ave Hedeen Abbeyfeale Unit 9066362
- 353 Sturges Ave
- 212 S Main St
- 96 Glenwood Heights
- 674 Hillgrove Ave
- 430 Beethoven St
- 223 Reform St
- 681 Hillgrove Ave
- 519 S Diamond St
- 175 S Mulberry St
- 181 Chilton Ave
- 401 S Main St
- 415 S Main St
- 397 S Main St
- 411 S Main St
- 419 S Main St
- 395 S Main St
- 0 S Main St 395 Richland Unit 5971357-8797021
- 22 Chestnut St E
- 28 Chestnut St E
- 421 S Main St
- 406 S Main St
- 408 S Main St
- 32 Chestnut St E
- 398 Hammond Ave
- 427 S Main St
- 400 Hammond Ave
- 406 Hammond Ave
- 383-385 S Main St
- 383 S Main St
- 383 S Main St Unit 385