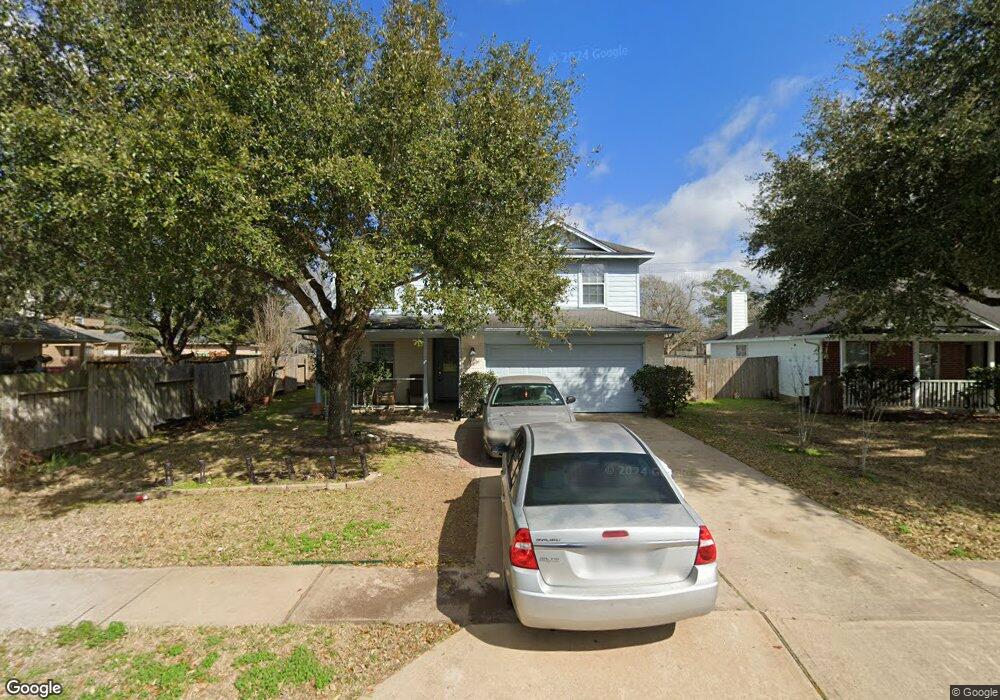
403 Seaborne Meadow Dr Rosenberg, TX 77471
Estimated Value: $271,000 - $301,000
3
Beds
3
Baths
2,453
Sq Ft
$117/Sq Ft
Est. Value
About This Home
This home is located at 403 Seaborne Meadow Dr, Rosenberg, TX 77471 and is currently estimated at $286,685, approximately $116 per square foot. 403 Seaborne Meadow Dr is a home located in Fort Bend County with nearby schools including Bowie Elementary School, Navarro Middle School, and George Junior High School.
Ownership History
Date
Name
Owned For
Owner Type
Purchase Details
Closed on
Jun 3, 2023
Sold by
Williams Charles Ray
Bought by
Dogan Wyvonne R
Current Estimated Value
Purchase Details
Closed on
Jan 2, 2019
Sold by
Dogan Wyvonne Rena
Bought by
Williams Charles Ray
Purchase Details
Closed on
Feb 7, 2006
Sold by
Identity Seabourne Lp
Bought by
Dogan Wyvonne
Home Financials for this Owner
Home Financials are based on the most recent Mortgage that was taken out on this home.
Original Mortgage
$137,359
Interest Rate
8%
Mortgage Type
Fannie Mae Freddie Mac
Purchase Details
Closed on
Dec 16, 2005
Sold by
Seabourne Meadows Development Lp
Bought by
Identity Seabourne Lp
Home Financials for this Owner
Home Financials are based on the most recent Mortgage that was taken out on this home.
Original Mortgage
$137,359
Interest Rate
8%
Mortgage Type
Fannie Mae Freddie Mac
Create a Home Valuation Report for This Property
The Home Valuation Report is an in-depth analysis detailing your home's value as well as a comparison with similar homes in the area
Home Values in the Area
Average Home Value in this Area
Purchase History
| Date | Buyer | Sale Price | Title Company |
|---|---|---|---|
| Dogan Wyvonne R | -- | None Listed On Document | |
| Williams Charles Ray | -- | None Available | |
| Dogan Wyvonne | -- | Universal Land Title | |
| Identity Seabourne Lp | -- | Universal Land Title | |
| Dogan Wyvonne | -- | -- |
Source: Public Records
Mortgage History
| Date | Status | Borrower | Loan Amount |
|---|---|---|---|
| Previous Owner | Dogan Wyvonne | $137,359 |
Source: Public Records
Tax History Compared to Growth
Tax History
| Year | Tax Paid | Tax Assessment Tax Assessment Total Assessment is a certain percentage of the fair market value that is determined by local assessors to be the total taxable value of land and additions on the property. | Land | Improvement |
|---|---|---|---|---|
| 2025 | $5,552 | $334,725 | $48,965 | $285,760 |
| 2024 | $5,552 | $293,928 | $48,965 | $244,963 |
| 2023 | $1,186 | $218,152 | $0 | $246,251 |
| 2022 | $2,404 | $198,320 | $0 | $205,160 |
| 2021 | $3,741 | $180,290 | $37,670 | $142,620 |
| 2020 | $3,873 | $182,490 | $28,880 | $153,610 |
| 2019 | $4,273 | $187,070 | $28,880 | $158,190 |
| 2018 | $3,810 | $164,170 | $28,880 | $135,290 |
| 2017 | $3,679 | $157,610 | $28,880 | $128,730 |
| 2016 | $3,428 | $146,870 | $28,880 | $117,990 |
| 2015 | $2,632 | $133,520 | $28,880 | $104,640 |
| 2014 | $2,529 | $121,380 | $28,880 | $92,500 |
Source: Public Records
Map
Nearby Homes
- 802 Matamoros Dr
- 1015 Santa fe Ct
- 206 Timothy Trail
- 217 Timothy Trail
- 2511 Spur 529
- 805 Avenue J
- 903 Brooks Ave
- 3326 Tilley Dr
- 0 Muegge Rd Unit 43223201
- 1112 James St
- 000 Bamore Rd
- 1108 Easy St
- 1208 Klare Ave
- 1301 Southgate Dr
- 1126 Brooks Ave
- 00 Brooks Ave
- 1400 Dyer Ave
- 804 Grunwald Heights Blvd
- 1333 Highway 36 N
- 1613 Mulcahy St
- 407 Seaborne Meadow Dr
- 407 Seabourne Meadows Dr
- 915 Gulf Ct
- 923 Gulf Ct
- 222 Prairie Ln
- 411 Seaborne Meadow Dr
- 903 Gulf Ct
- 415 Seaborne Meadow Dr
- 1002 San Antonio Ct
- 1002 San Antonio Ct
- 226 Prairie Ln
- 503 Seaborne Meadow Dr
- 1006 San Antonio Ct
- 918 Gulf Ct
- 914 Gulf Ct
- 914 Gulf Ct
- 914 Gulf Ct
- 922 Gulf Ct
- 507 Seabourne Meadow Dr
- 507 Seaborne Meadow Dr