Estimated Value: $158,864 - $176,000
3
Beds
3
Baths
1,263
Sq Ft
$132/Sq Ft
Est. Value
About This Home
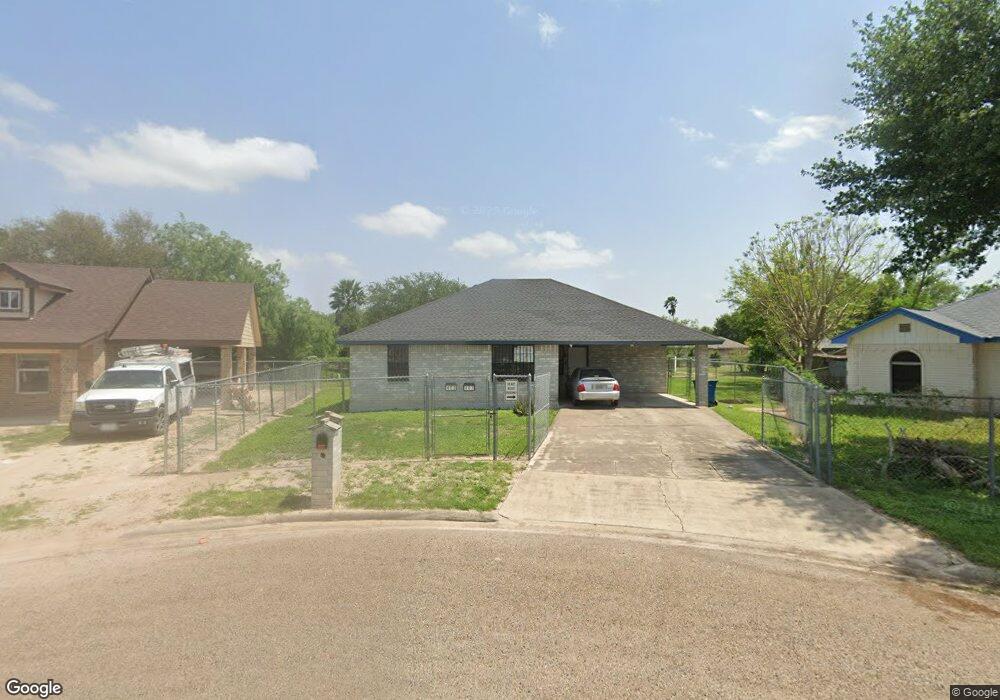
This home is located at 403 Stuart Ct, Alamo, TX 78516 and is currently estimated at $167,216, approximately $132 per square foot. 403 Stuart Ct is a home located in Hidalgo County with nearby schools including Capt. D. Salinas Elementary School, A.P. Solis Middle School, and Donna High School.
Ownership History
Date
Name
Owned For
Owner Type
Purchase Details
Closed on
May 6, 2019
Sold by
Decker Elida
Bought by
Decker James A
Current Estimated Value
Purchase Details
Closed on
Mar 5, 1998
Sold by
Hidalgo County Dev Inc
Bought by
Decker James A and Decker Elida
Home Financials for this Owner
Home Financials are based on the most recent Mortgage that was taken out on this home.
Original Mortgage
$58,280
Outstanding Balance
$20,611
Interest Rate
7.13%
Estimated Equity
$146,605
Create a Home Valuation Report for This Property
The Home Valuation Report is an in-depth analysis detailing your home's value as well as a comparison with similar homes in the area
Home Values in the Area
Average Home Value in this Area
Purchase History
| Date | Buyer | Sale Price | Title Company |
|---|---|---|---|
| Decker James A | -- | None Available | |
| Decker James A | $9,000 | -- |
Source: Public Records
Mortgage History
| Date | Status | Borrower | Loan Amount |
|---|---|---|---|
| Open | Decker James A | $58,280 | |
| Closed | Decker James A | $1,200 |
Source: Public Records
Tax History Compared to Growth
Tax History
| Year | Tax Paid | Tax Assessment Tax Assessment Total Assessment is a certain percentage of the fair market value that is determined by local assessors to be the total taxable value of land and additions on the property. | Land | Improvement |
|---|---|---|---|---|
| 2025 | $1,782 | $121,991 | -- | -- |
| 2024 | $1,782 | $110,901 | -- | -- |
| 2023 | $2,566 | $100,819 | $0 | $0 |
| 2022 | $2,388 | $91,654 | $0 | $0 |
| 2021 | $2,186 | $83,322 | $17,425 | $65,897 |
| 2020 | $2,116 | $78,060 | $17,425 | $60,638 |
| 2019 | $1,946 | $70,964 | $17,425 | $53,539 |
| 2018 | $1,953 | $71,684 | $17,425 | $54,259 |
| 2017 | $1,997 | $72,404 | $17,425 | $54,979 |
| 2016 | $1,999 | $72,449 | $16,031 | $56,418 |
| 2015 | $1,666 | $73,476 | $16,031 | $57,857 |
Source: Public Records
Map
Nearby Homes
- 405 Tudor Ct
- 1101 S Tower Rd
- 417 Charles Cir
- 1001 Las Flores Dr
- 504 Monterrey Dr
- 1009 Las Flores Dr
- 0 S Tower Rd
- 806 Post Oak Dr
- 502 E Fannin St
- 408 Rene St
- 524 E Fannin Ave
- 534 Hunter Dr
- 482 Cripple Creek Cir
- 806 Dulce Dr
- 826 Sabrina Dr
- 1118 Esparanza St
- 822 Lark St
- 421 Serg Loop
- 419 Serg Loop
- 813 Dove St