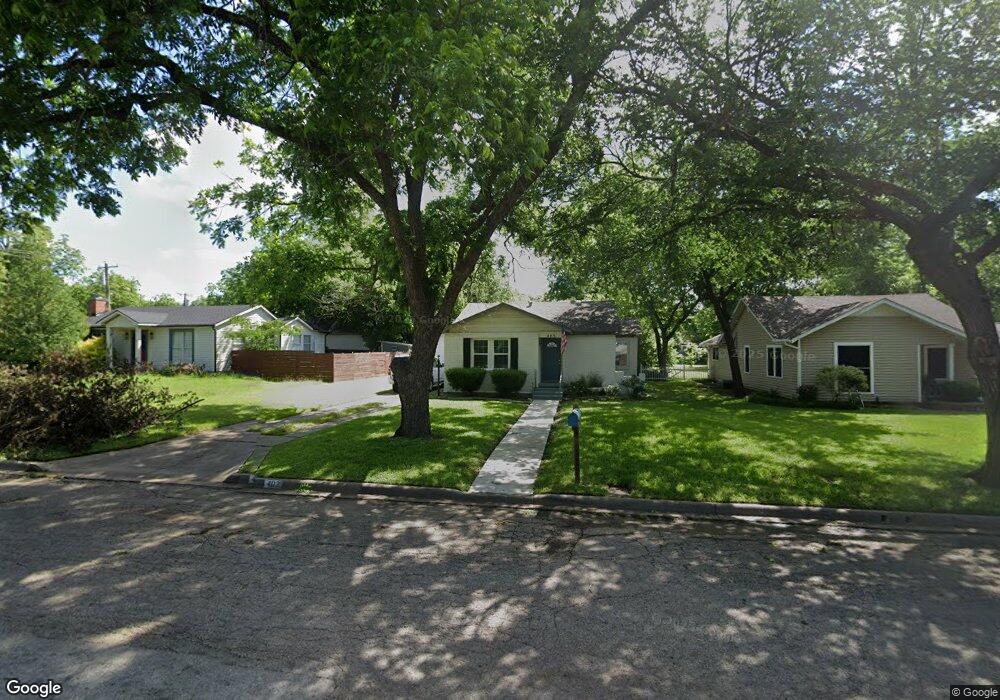
403 Sunset Dr Cleburne, TX 76033
Estimated Value: $184,601 - $266,000
3
Beds
2
Baths
1,344
Sq Ft
$164/Sq Ft
Est. Value
About This Home
This home is located at 403 Sunset Dr, Cleburne, TX 76033 and is currently estimated at $219,900, approximately $163 per square foot. 403 Sunset Dr is a home located in Johnson County with nearby schools including Coleman Elementary School, Lowell Smith Jr. Middle School, and Cleburne High School.
Ownership History
Date
Name
Owned For
Owner Type
Purchase Details
Closed on
Mar 3, 2026
Sold by
Robert Bruchmann
Bought by
Cleveland Lisa
Current Estimated Value
Purchase Details
Closed on
Aug 8, 2015
Sold by
Turner Ashlidawn and Bradshaw Ashlidawn Turner
Bought by
Bruchmann Lisa
Home Financials for this Owner
Home Financials are based on the most recent Mortgage that was taken out on this home.
Original Mortgage
$81,300
Interest Rate
3.92%
Mortgage Type
New Conventional
Purchase Details
Closed on
Apr 1, 2013
Sold by
Petty Danielle and Petty Michael
Bought by
Turner Ashlidawn
Home Financials for this Owner
Home Financials are based on the most recent Mortgage that was taken out on this home.
Original Mortgage
$82,968
Interest Rate
3.59%
Mortgage Type
New Conventional
Purchase Details
Closed on
May 14, 2007
Sold by
Veterans Land Board Of The State Of Texa
Bought by
Steelman William Edward
Create a Home Valuation Report for This Property
The Home Valuation Report is an in-depth analysis detailing your home's value as well as a comparison with similar homes in the area
Home Values in the Area
Average Home Value in this Area
Purchase History
| Date | Buyer | Sale Price | Title Company |
|---|---|---|---|
| Cleveland Lisa | -- | None Listed On Document | |
| Bruchmann Lisa | -- | Capital Title | |
| Turner Ashlidawn | -- | Republic Title Of Texas Inc | |
| Steelman William Edward | $20,000 | None Available |
Source: Public Records
Mortgage History
| Date | Status | Borrower | Loan Amount |
|---|---|---|---|
| Previous Owner | Bruchmann Lisa | $81,300 | |
| Previous Owner | Turner Ashlidawn | $82,968 |
Source: Public Records
Tax History
| Year | Tax Paid | Tax Assessment Tax Assessment Total Assessment is a certain percentage of the fair market value that is determined by local assessors to be the total taxable value of land and additions on the property. | Land | Improvement |
|---|---|---|---|---|
| 2025 | $847 | $101,830 | $31,000 | $70,830 |
| 2024 | $2,270 | $101,830 | $31,000 | $70,830 |
| 2023 | $847 | $101,830 | $31,000 | $70,830 |
| 2022 | $2,128 | $85,017 | $31,000 | $54,017 |
| 2021 | $4,436 | $170,034 | $62,000 | $108,034 |
| 2020 | $3,295 | $118,919 | $30,000 | $88,919 |
| 2019 | $3,514 | $118,919 | $30,000 | $88,919 |
| 2018 | $2,601 | $87,992 | $16,000 | $71,992 |
| 2017 | $2,590 | $87,992 | $16,000 | $71,992 |
| 2016 | $2,414 | $81,995 | $16,000 | $65,995 |
| 2015 | $2,058 | $81,995 | $16,000 | $65,995 |
| 2014 | $2,058 | $77,223 | $15,750 | $61,473 |
Source: Public Records
Map
Nearby Homes
- 502 Bellevue Dr
- 505 Bellevue Dr
- 714 Forrest Ave
- 611 Forrest Ave
- 503 W 3rd St
- 616 Bellevue Dr
- 804 Prairie Ave
- 505 W Earl St
- 805 Prairie Ave
- 813 Prairie Ave
- 107 Sunset Dr
- 1107 Stanwood Ave
- 703 Featherston St
- 832 Featherston St
- 1105 S Walnut St
- 4112 Highland Dr
- 415 Featherston St
- 306 Prairie Ave
- 911 W Chambers St
- 504 Featherston St
Your Personal Tour Guide
Ask me questions while you tour the home.