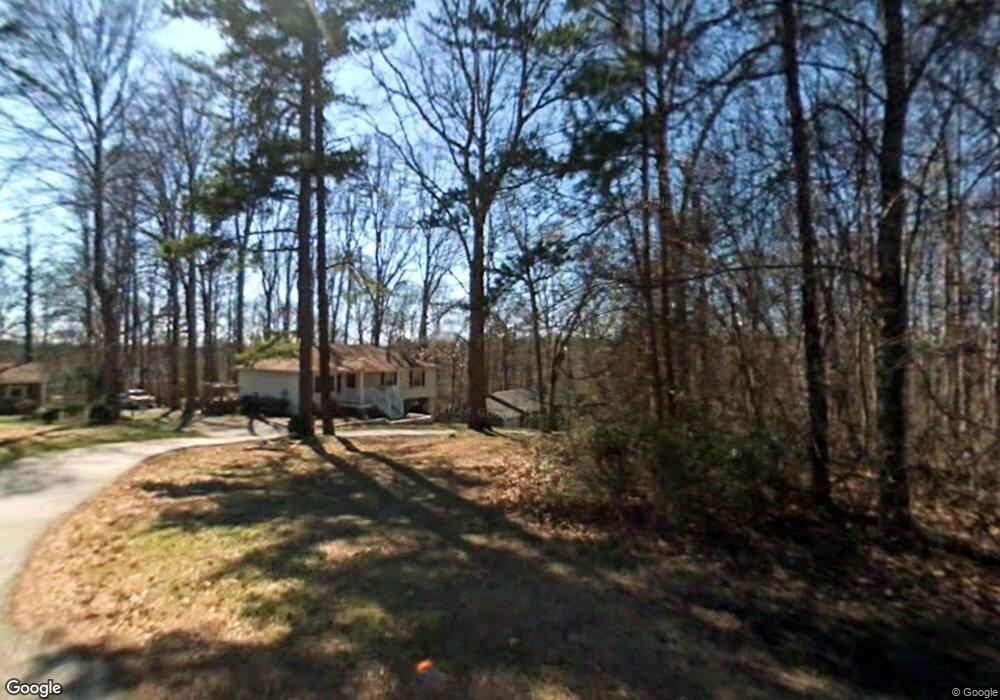
403 Sylvia Rd Easley, SC 29642
Estimated Value: $199,000 - $254,000
3
Beds
2
Baths
1,232
Sq Ft
$185/Sq Ft
Est. Value
About This Home
This home is located at 403 Sylvia Rd, Easley, SC 29642 and is currently estimated at $228,189, approximately $185 per square foot. 403 Sylvia Rd is a home located in Pickens County with nearby schools including Forest Acres Elementary School, Richard H. Gettys Middle School, and Easley High School.
Ownership History
Date
Name
Owned For
Owner Type
Purchase Details
Closed on
Aug 19, 2009
Sold by
Brown David L and Brown Kirsten G
Bought by
Bright Amy D
Current Estimated Value
Home Financials for this Owner
Home Financials are based on the most recent Mortgage that was taken out on this home.
Original Mortgage
$94,963
Outstanding Balance
$60,674
Interest Rate
5.14%
Estimated Equity
$167,515
Purchase Details
Closed on
Jul 28, 2006
Sold by
Hsbc Mortgage Services Inc
Bought by
Brown David L and Brown Kirsten G
Home Financials for this Owner
Home Financials are based on the most recent Mortgage that was taken out on this home.
Original Mortgage
$76,500
Interest Rate
6.6%
Mortgage Type
New Conventional
Purchase Details
Closed on
Jan 19, 2006
Sold by
Fulbright Steve
Bought by
Hsbc Mortgage Services Inc
Purchase Details
Closed on
Jan 28, 2005
Sold by
Fulbright Billy
Bought by
Fulbright Steve
Home Financials for this Owner
Home Financials are based on the most recent Mortgage that was taken out on this home.
Original Mortgage
$22,200
Interest Rate
5.16%
Create a Home Valuation Report for This Property
The Home Valuation Report is an in-depth analysis detailing your home's value as well as a comparison with similar homes in the area
Home Values in the Area
Average Home Value in this Area
Purchase History
| Date | Buyer | Sale Price | Title Company |
|---|---|---|---|
| Bright Amy D | $97,900 | -- | |
| Brown David L | $85,000 | None Available | |
| Hsbc Mortgage Services Inc | -- | None Available | |
| Fulbright Steve | $111,000 | None Available |
Source: Public Records
Mortgage History
| Date | Status | Borrower | Loan Amount |
|---|---|---|---|
| Open | Bright Amy D | $94,963 | |
| Previous Owner | Brown David L | $76,500 | |
| Previous Owner | Fulbright Steve | $22,200 | |
| Previous Owner | Fulbright Steve | $88,800 |
Source: Public Records
Tax History
| Year | Tax Paid | Tax Assessment Tax Assessment Total Assessment is a certain percentage of the fair market value that is determined by local assessors to be the total taxable value of land and additions on the property. | Land | Improvement |
|---|---|---|---|---|
| 2025 | $629 | $4,890 | $830 | $4,060 |
| 2024 | $629 | $4,250 | $720 | $3,530 |
| 2023 | $560 | $4,250 | $720 | $3,530 |
| 2022 | $516 | $4,250 | $720 | $3,530 |
| 2021 | $509 | $4,250 | $720 | $3,530 |
| 2020 | $500 | $4,252 | $720 | $3,532 |
| 2019 | $503 | $4,250 | $720 | $3,530 |
| 2018 | $497 | $3,860 | $720 | $3,140 |
| 2017 | $462 | $3,860 | $720 | $3,140 |
| 2015 | $490 | $3,860 | $0 | $0 |
| 2008 | -- | $4,320 | $640 | $3,680 |
Source: Public Records
Map
Nearby Homes
- 119 Whitman Way
- 207 Benjamin Dr
- 411 Briggs Dr
- 435 Briggs Dr
- 445 Briggs Dr
- 103 Indigo Park Place
- 440 Briggs Dr
- 107 Indigo Park Place
- 113 Indigo Park Place
- 108 Indigo Park Place
- 131 Indigo Park Place
- 100 Indigo Cir
- 276 Springfield Cir
- 1317 Brushy Creek Rd
- 1709 Brushy Creek Rd
- 208 Spring Dr
- 114 Marianne Ln
- 116 Marianne Ln
- 118 Marianne Ln
- 120 Marianne Ln
- 401 Sylvia Rd
- 405 Sylvia Rd
- 308 Longview Terrace
- 306 Longview Terrace
- 304 Longview Terrace
- 327 Sylvia Rd
- 0 Iris Drive and Sylvia Rd Unit 2029863
- 0 Iris Drive and Sylvia Rd Unit 1902828
- 0 Iris Drive and Sylvia Rd Unit 1902830
- 0 Iris Drive and Sylvia Rd Unit 1902831
- 0 Iris Drive and Sylvia Rd Unit 1902832
- 302 Longview Terrace
- 219 Iris Dr
- 113 Whitman Way
- 122 Whitman Way
- 120 Whitman Way
- 208 Benjamin Dr
- 109 Benjamin Dr
- 128 Whitman Way
- 126 Whitman Way
Your Personal Tour Guide
Ask me questions while you tour the home.