Estimated Value: $126,000 - $171,339
4
Beds
2
Baths
841
Sq Ft
$181/Sq Ft
Est. Value
About This Home
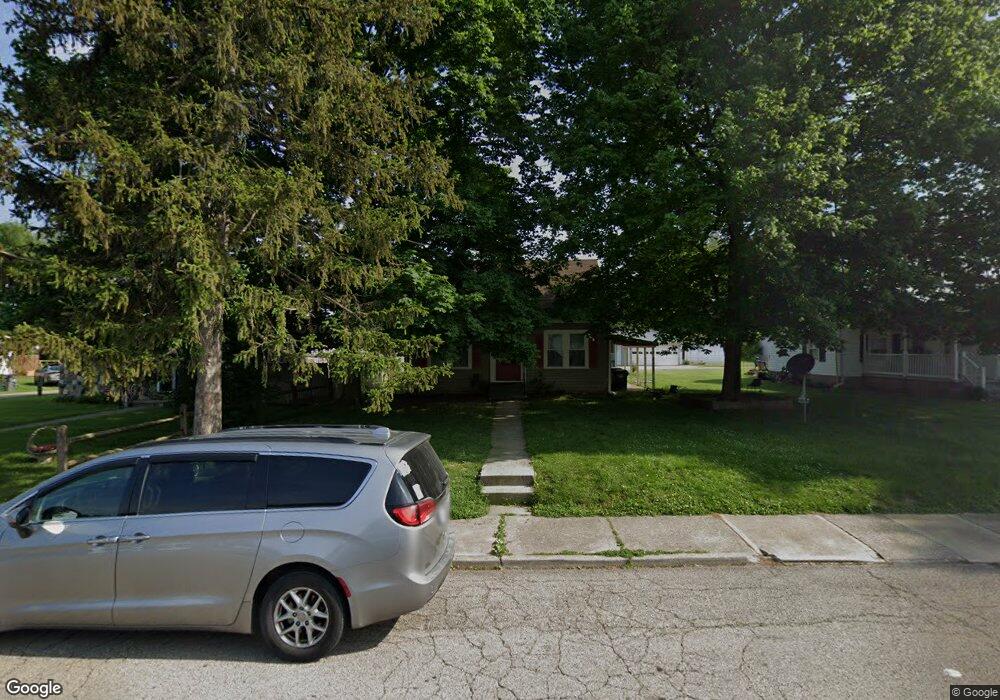
This home is located at 403 Troy St, Troy, OH 45373 and is currently estimated at $152,335, approximately $181 per square foot. 403 Troy St is a home located in Miami County with nearby schools including Cookson Elementary School, Troy Junior High School, and Van Cleve Elementary School.
Ownership History
Date
Name
Owned For
Owner Type
Purchase Details
Closed on
Jan 27, 2014
Sold by
Fisher Joseph J
Bought by
Angle Donald E and Angle Jacquiline M
Current Estimated Value
Purchase Details
Closed on
Jun 8, 2004
Sold by
Mcgillvary Vincent B
Bought by
Fisher Joseph J
Home Financials for this Owner
Home Financials are based on the most recent Mortgage that was taken out on this home.
Original Mortgage
$92,761
Interest Rate
5.99%
Mortgage Type
FHA
Purchase Details
Closed on
Jun 24, 1999
Sold by
Mcgillvary Emily S
Bought by
Mcgillvary Vincent B
Purchase Details
Closed on
Apr 1, 1989
Bought by
Gustin Larry K
Create a Home Valuation Report for This Property
The Home Valuation Report is an in-depth analysis detailing your home's value as well as a comparison with similar homes in the area
Home Values in the Area
Average Home Value in this Area
Purchase History
| Date | Buyer | Sale Price | Title Company |
|---|---|---|---|
| Angle Donald E | $50,000 | Attorney | |
| Fisher Joseph J | $94,218 | -- | |
| Mcgillvary Vincent B | -- | -- | |
| Gustin Larry K | -- | -- |
Source: Public Records
Mortgage History
| Date | Status | Borrower | Loan Amount |
|---|---|---|---|
| Previous Owner | Mcgillvary Vincent B | $92,761 |
Source: Public Records
Tax History
| Year | Tax Paid | Tax Assessment Tax Assessment Total Assessment is a certain percentage of the fair market value that is determined by local assessors to be the total taxable value of land and additions on the property. | Land | Improvement |
|---|---|---|---|---|
| 2024 | $1,774 | $41,310 | $9,280 | $32,030 |
| 2023 | $1,591 | $41,310 | $9,280 | $32,030 |
| 2022 | $1,331 | $41,310 | $9,280 | $32,030 |
| 2021 | $1,078 | $31,780 | $7,140 | $24,640 |
| 2020 | $1,079 | $31,780 | $7,140 | $24,640 |
| 2019 | $1,089 | $31,780 | $7,140 | $24,640 |
| 2018 | $976 | $27,370 | $6,930 | $20,440 |
| 2017 | $986 | $27,370 | $6,930 | $20,440 |
| 2016 | $972 | $27,370 | $6,930 | $20,440 |
| 2015 | $913 | $25,350 | $6,410 | $18,940 |
| 2014 | $913 | $25,350 | $6,410 | $18,940 |
| 2013 | $919 | $25,350 | $6,410 | $18,940 |
Source: Public Records
Map
Nearby Homes
- 708 N Market St
- 506 Michigan Ave
- 555 Miami St
- 598 N Market St
- 1075 Crestview Dr
- 1117 Scenic Ct
- 1210 Charleston Ct
- 1008 Plymouth Ct
- 1142 Lee Rd
- 1063 Linwood Dr
- 491 Mayfield Square E
- 607 W Bentley Cir
- 118 S Walnut St
- 1057 Stonyridge Ave
- 755 W Bentley Cir
- 1206 Heritage Dr
- 1334 Skylark Dr
- 619 E Canal St
- 29 S Monroe St
- 1329 Lee Rd
Your Personal Tour Guide
Ask me questions while you tour the home.